Complete Magento 2 Store Monitoring — Health, Security, Performance, Cache & Infrastructure in One Dashboard.
MageMonitor runs entirely on your server inside the Magento admin panel. No external services, no cloud agents, no data leaving your store. Install it, run a scan, and get an immediate, prioritized picture of everything affecting your store's health — with exact fix instructions for every issue found.
✓Health score (0–100) with 10 automated detectors — Server, Magento, Database, Frontend, Extensions, Performance, Security, Search, Cron Health & Cache Health
✓Cache monitoring for Varnish, Redis, Magento FPC and OPcache — hit rates, eviction detection, backend failures, and one-click fixes
✓Live metrics auto-refreshing every 10 seconds, slow request profiler, JS error collection from real browsers, and uptime monitoring every 3 minutes
✓15 Quick Fix actions — flush cache, reindex, optimize tables, kill zombie crons, enable maintenance mode, warm cache, and more — all logged to audit trail
✓AWS CloudFront & WAF integration, Cloudflare support, multi-channel alerts via Email, Slack, and Webhook with configurable digest schedules
✓Every detection includes a specific fix with exact CLI commands — not a generic suggestion. Exportable health report with PDF download.
MageMonitor is a complete store health monitoring system built inside your Magento admin. It scans your server, database, cron, cache, frontend, and security posture automatically — then tells you exactly what's wrong and exactly how to fix it.
10 automated detectors run on schedule across every layer of your store — server, DB, cache, cron, frontend, security, search, and more.
Every detection includes the exact CLI command or SQL query to fix it — no vague suggestions, no developer needed to interpret the output.
100% server-side. No external agents. No cloud subscriptions. No data leaving your server. Works on AWS, VPS, shared hosting, and Docker.
Magento 2.4.0 – 2.4.9PHP 8.1 / 8.2 / 8.3No External APIsGDPR CompliantBy Point of Code
10
Automated Detectors
100+
Individual Health Checks
19
Background Cron Jobs
3min
Uptime Check Interval
Most Magento store problems are discovered by customers before the merchant knows anything is wrong. A slow checkout, a broken JS error, a cron job that stopped running 3 days ago — these are the issues that cause cart abandonment, lost orders, and support tickets. MageMonitor finds them first.
Every scan runs locally on your server using read-only queries. No data ever leaves your environment. MageMonitor writes only to its own database tables and never touches customer data, orders, or store configuration.
Why MageMonitor
Problems found before your customers notice them.
The alternative is finding out about problems from a customer complaint, a Slack message at 2am, or a sales report that looks wrong. MageMonitor changes that.
Actionable — Not Just Alerts
Every detection includes a specific how-to-fix with exact commands. Not "your cron is slow" but "run this exact SQL to clear the backlog and fix the issue in 60 seconds."
Every Layer of Your Store
Server health, database, cron, cache (Varnish, Redis, FPC, OPcache), frontend JS errors, security, search, extensions, SSL — all covered in a single dashboard.
Private by Design
Runs entirely on your server. No cloud agents, no outbound API calls, no third-party data storage. Your store's data never leaves your environment. GDPR compliant out of the box.
Feature 01
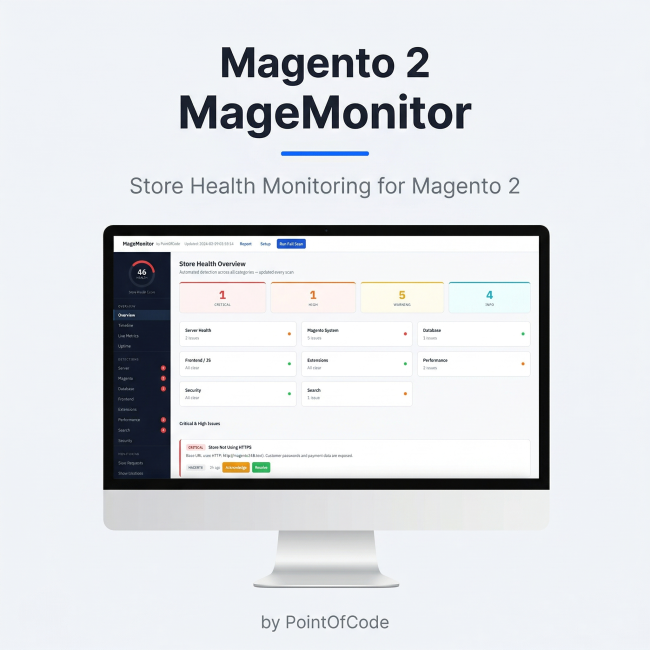
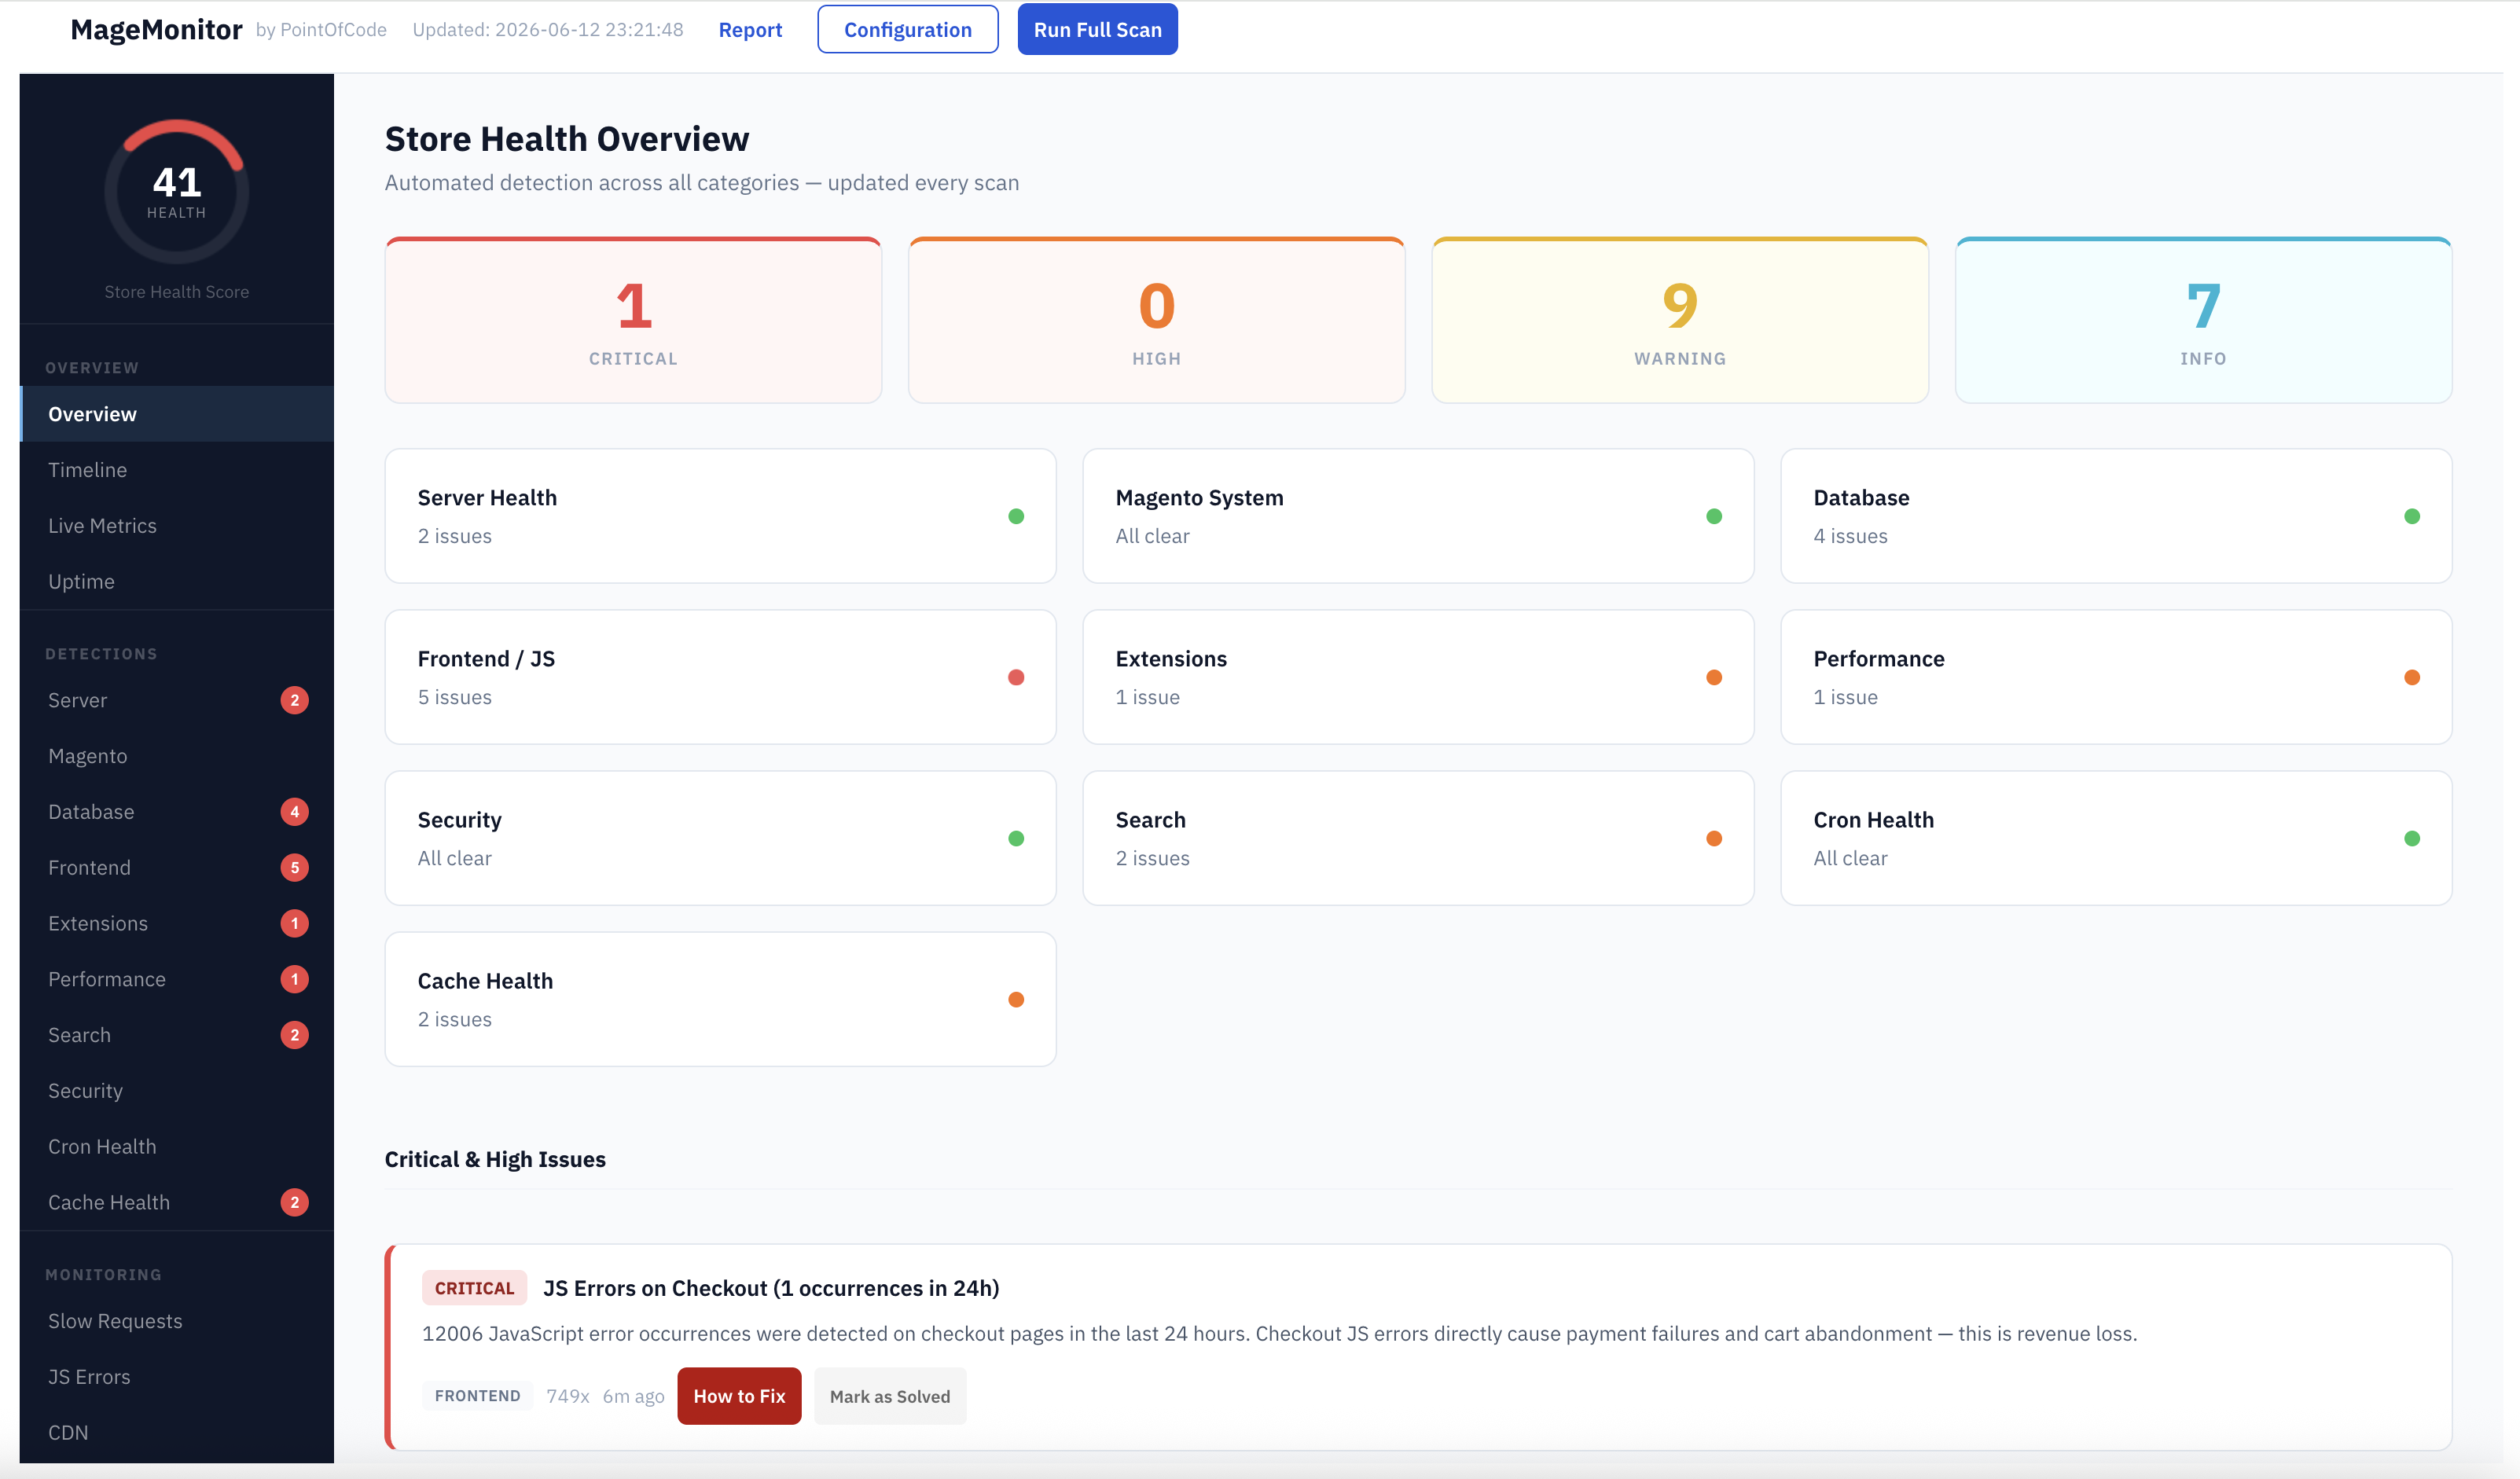
Health Score Overview
The first thing you see is a complete picture of your store's health — a numeric score (0–100), a category status grid, and a prioritized list of all active issues that need attention. Nothing is buried, nothing requires interpretation.
Health score recalculated on every scan (0 = critical problems, 100 = all clear)
Category cards for Server, Magento, Database, Frontend, Extensions, Performance, Security, Search, Cron Health, Cache Health
All Critical and High issues listed directly on the overview
Severity badges: CRITICALHIGHWARNINGINFO
Mark as Solved and How to Fix actions per detection
One-click full scan across all 10 detection categories
Feature 02
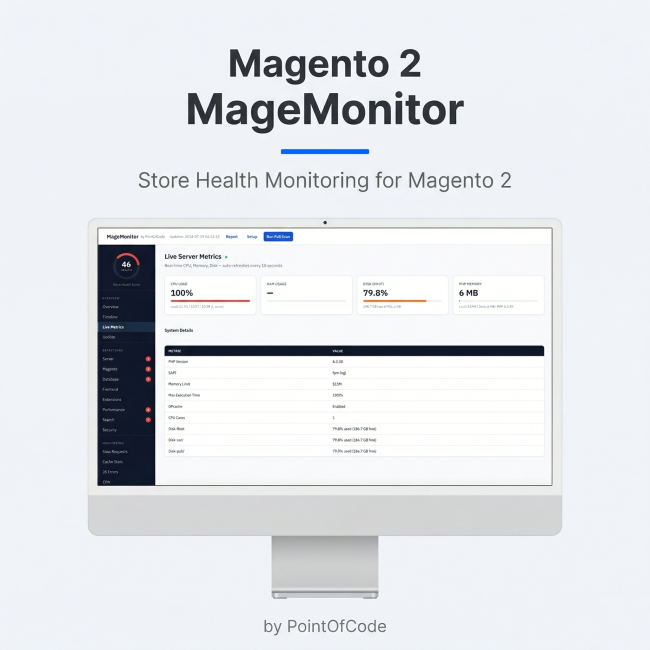
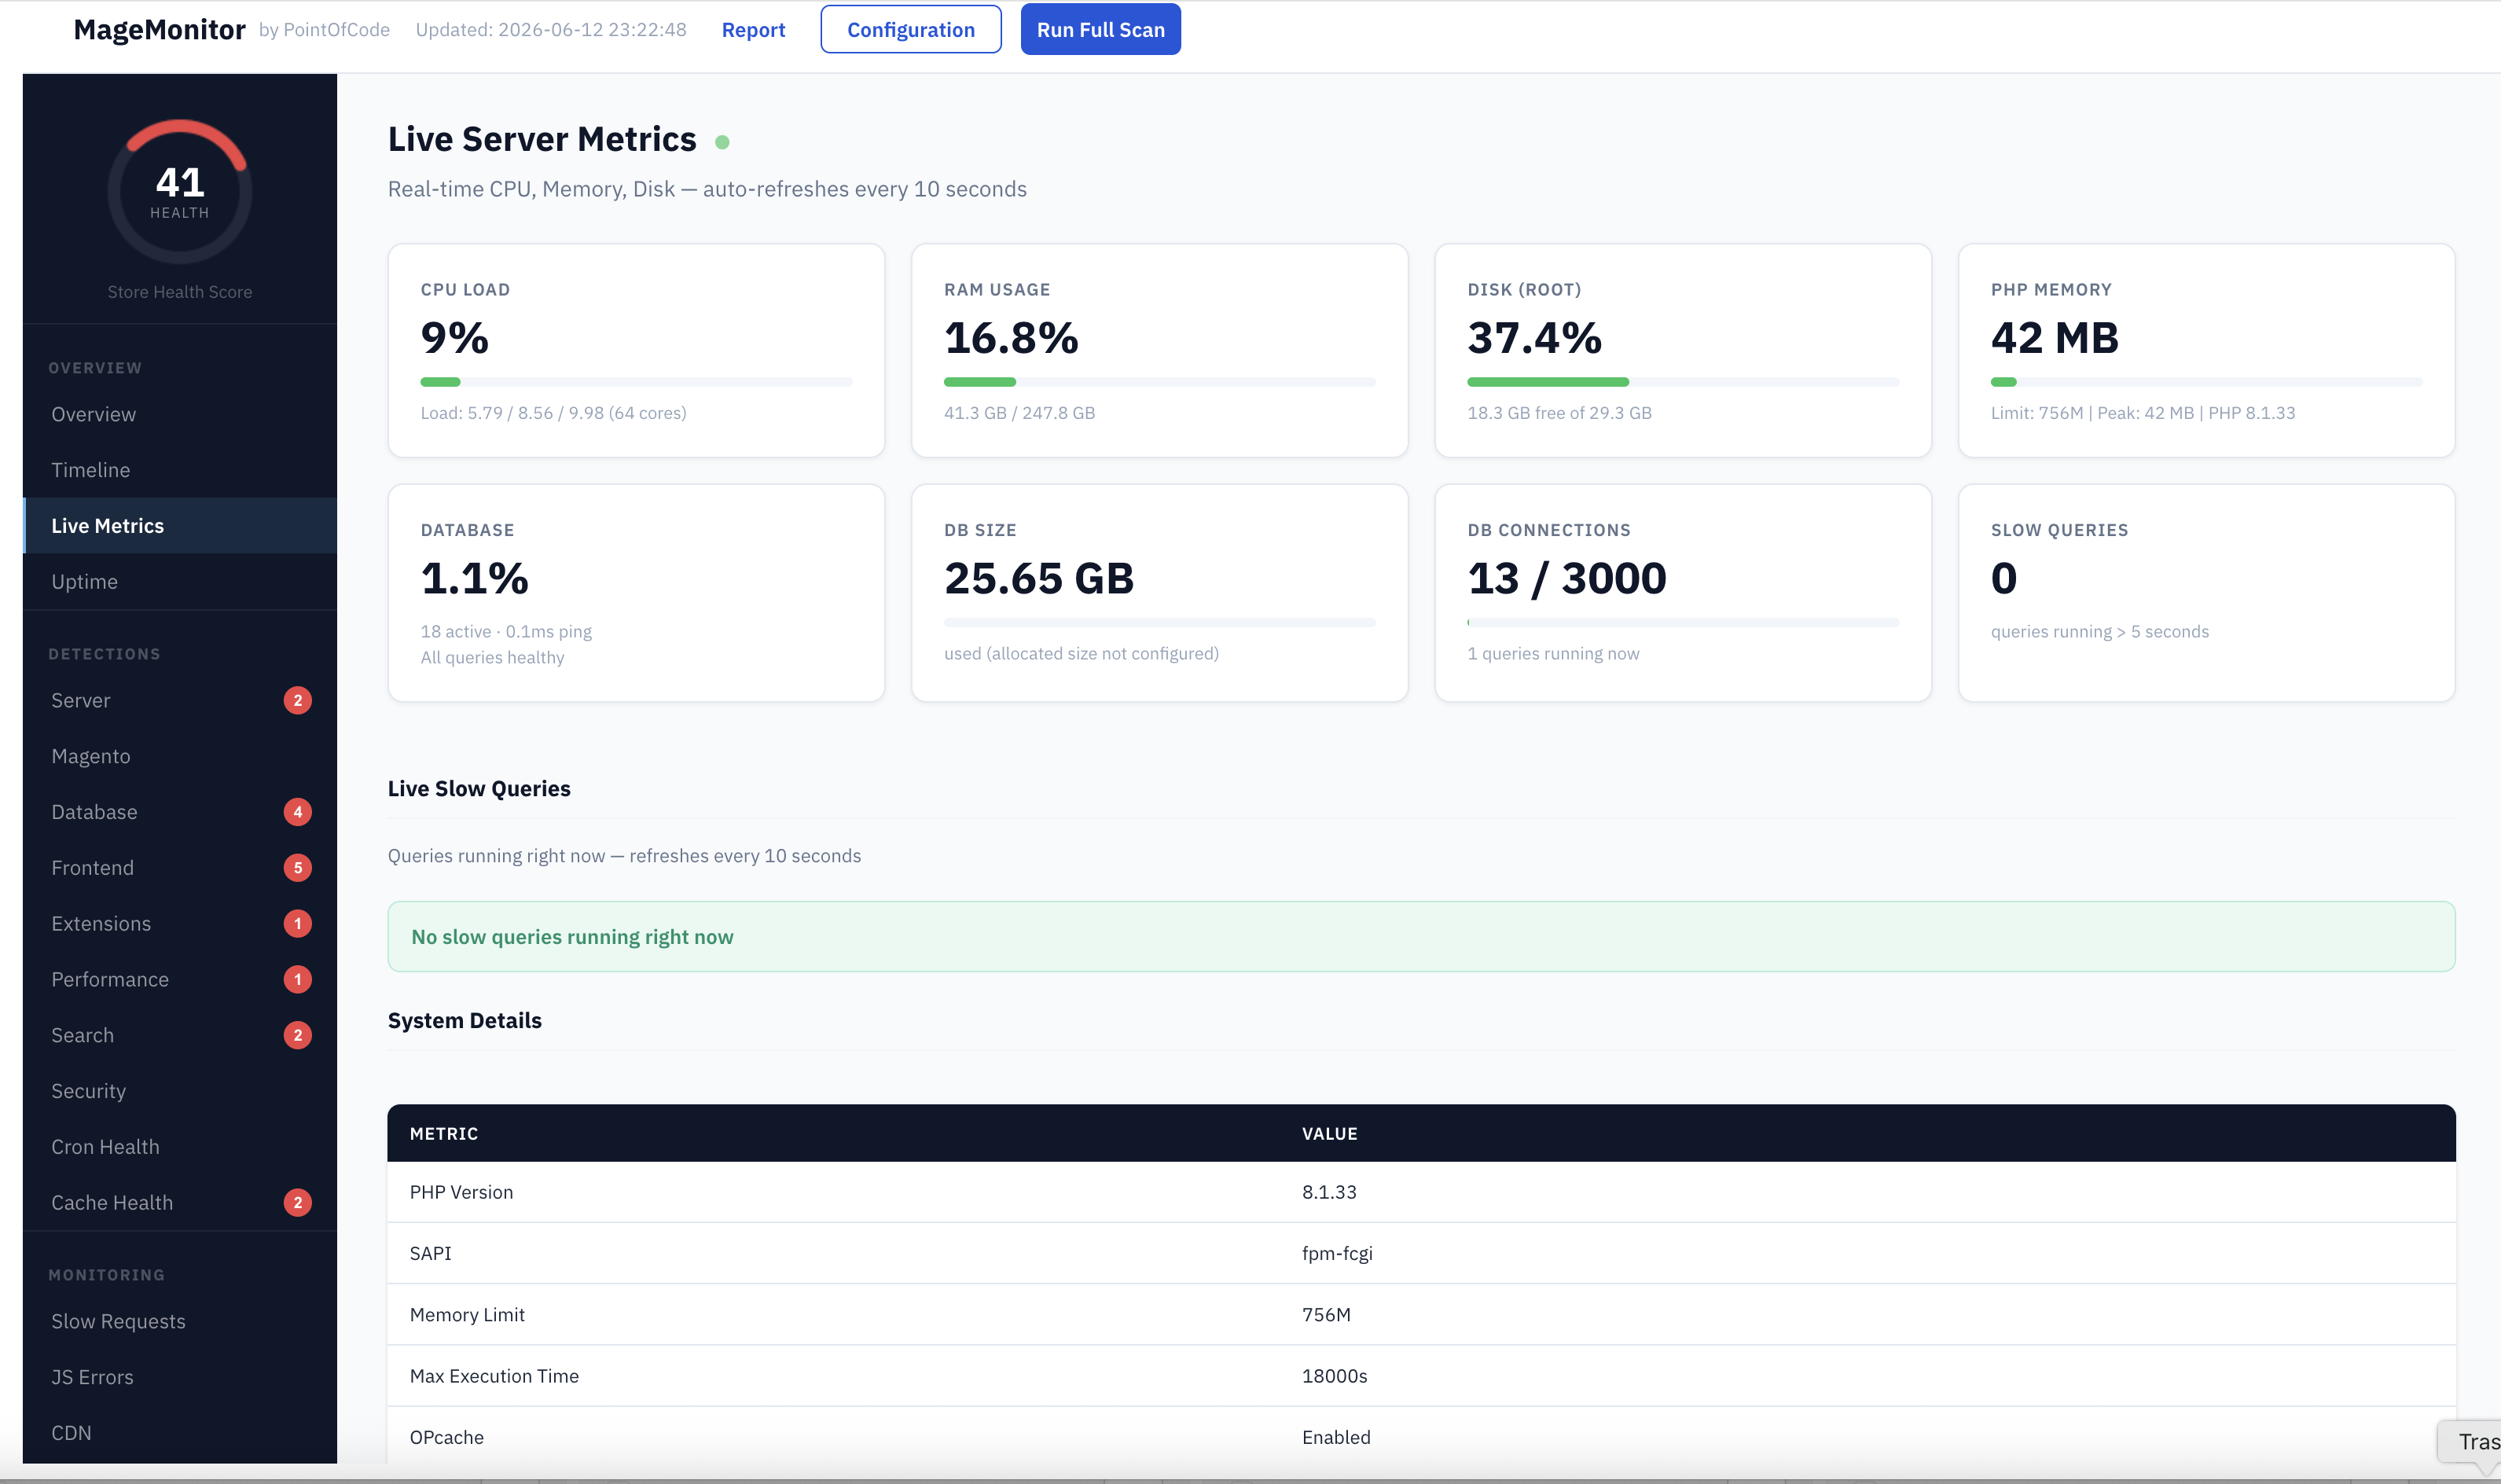
Live Server Metrics
Real-time metrics that auto-refresh every 10 seconds without page reload. See exactly what your server is doing right now — CPU, RAM, disk, PHP memory, database connections, and active slow queries.
CPU load, RAM, disk usage with visual progress bars
Database size, active connections vs max, slow queries count
Live slow query panel — shows queries running >5s right now with SQL snippet
PHP version, SAPI, memory limit, max execution time, OPcache status
MySQL version, InnoDB buffer pool, max connections, slow query log status
Auto-refreshes every 10 seconds — no manual reload needed
Feature 03
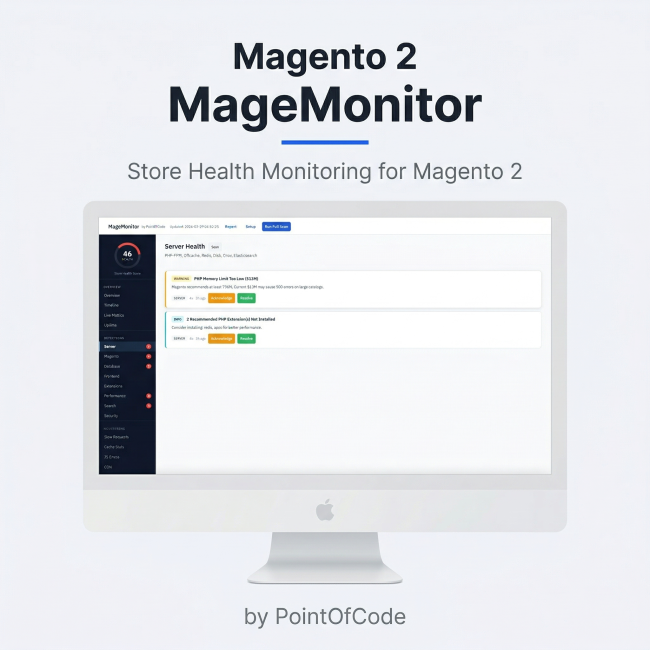
10 Specialized Detection Tabs
Each category has its own tab showing active detections at the top, followed by analytical data specific to that domain. Every detector runs independently — one failure never affects others.
Server
PHP-FPM health, OPcache, disk usage, Redis, cron ownership, health check endpoint, admin brute force
Varnish hit rate & backend failures, Redis memory/eviction policy, Magento FPC backend, OPcache hit rate & file count
Feature 04
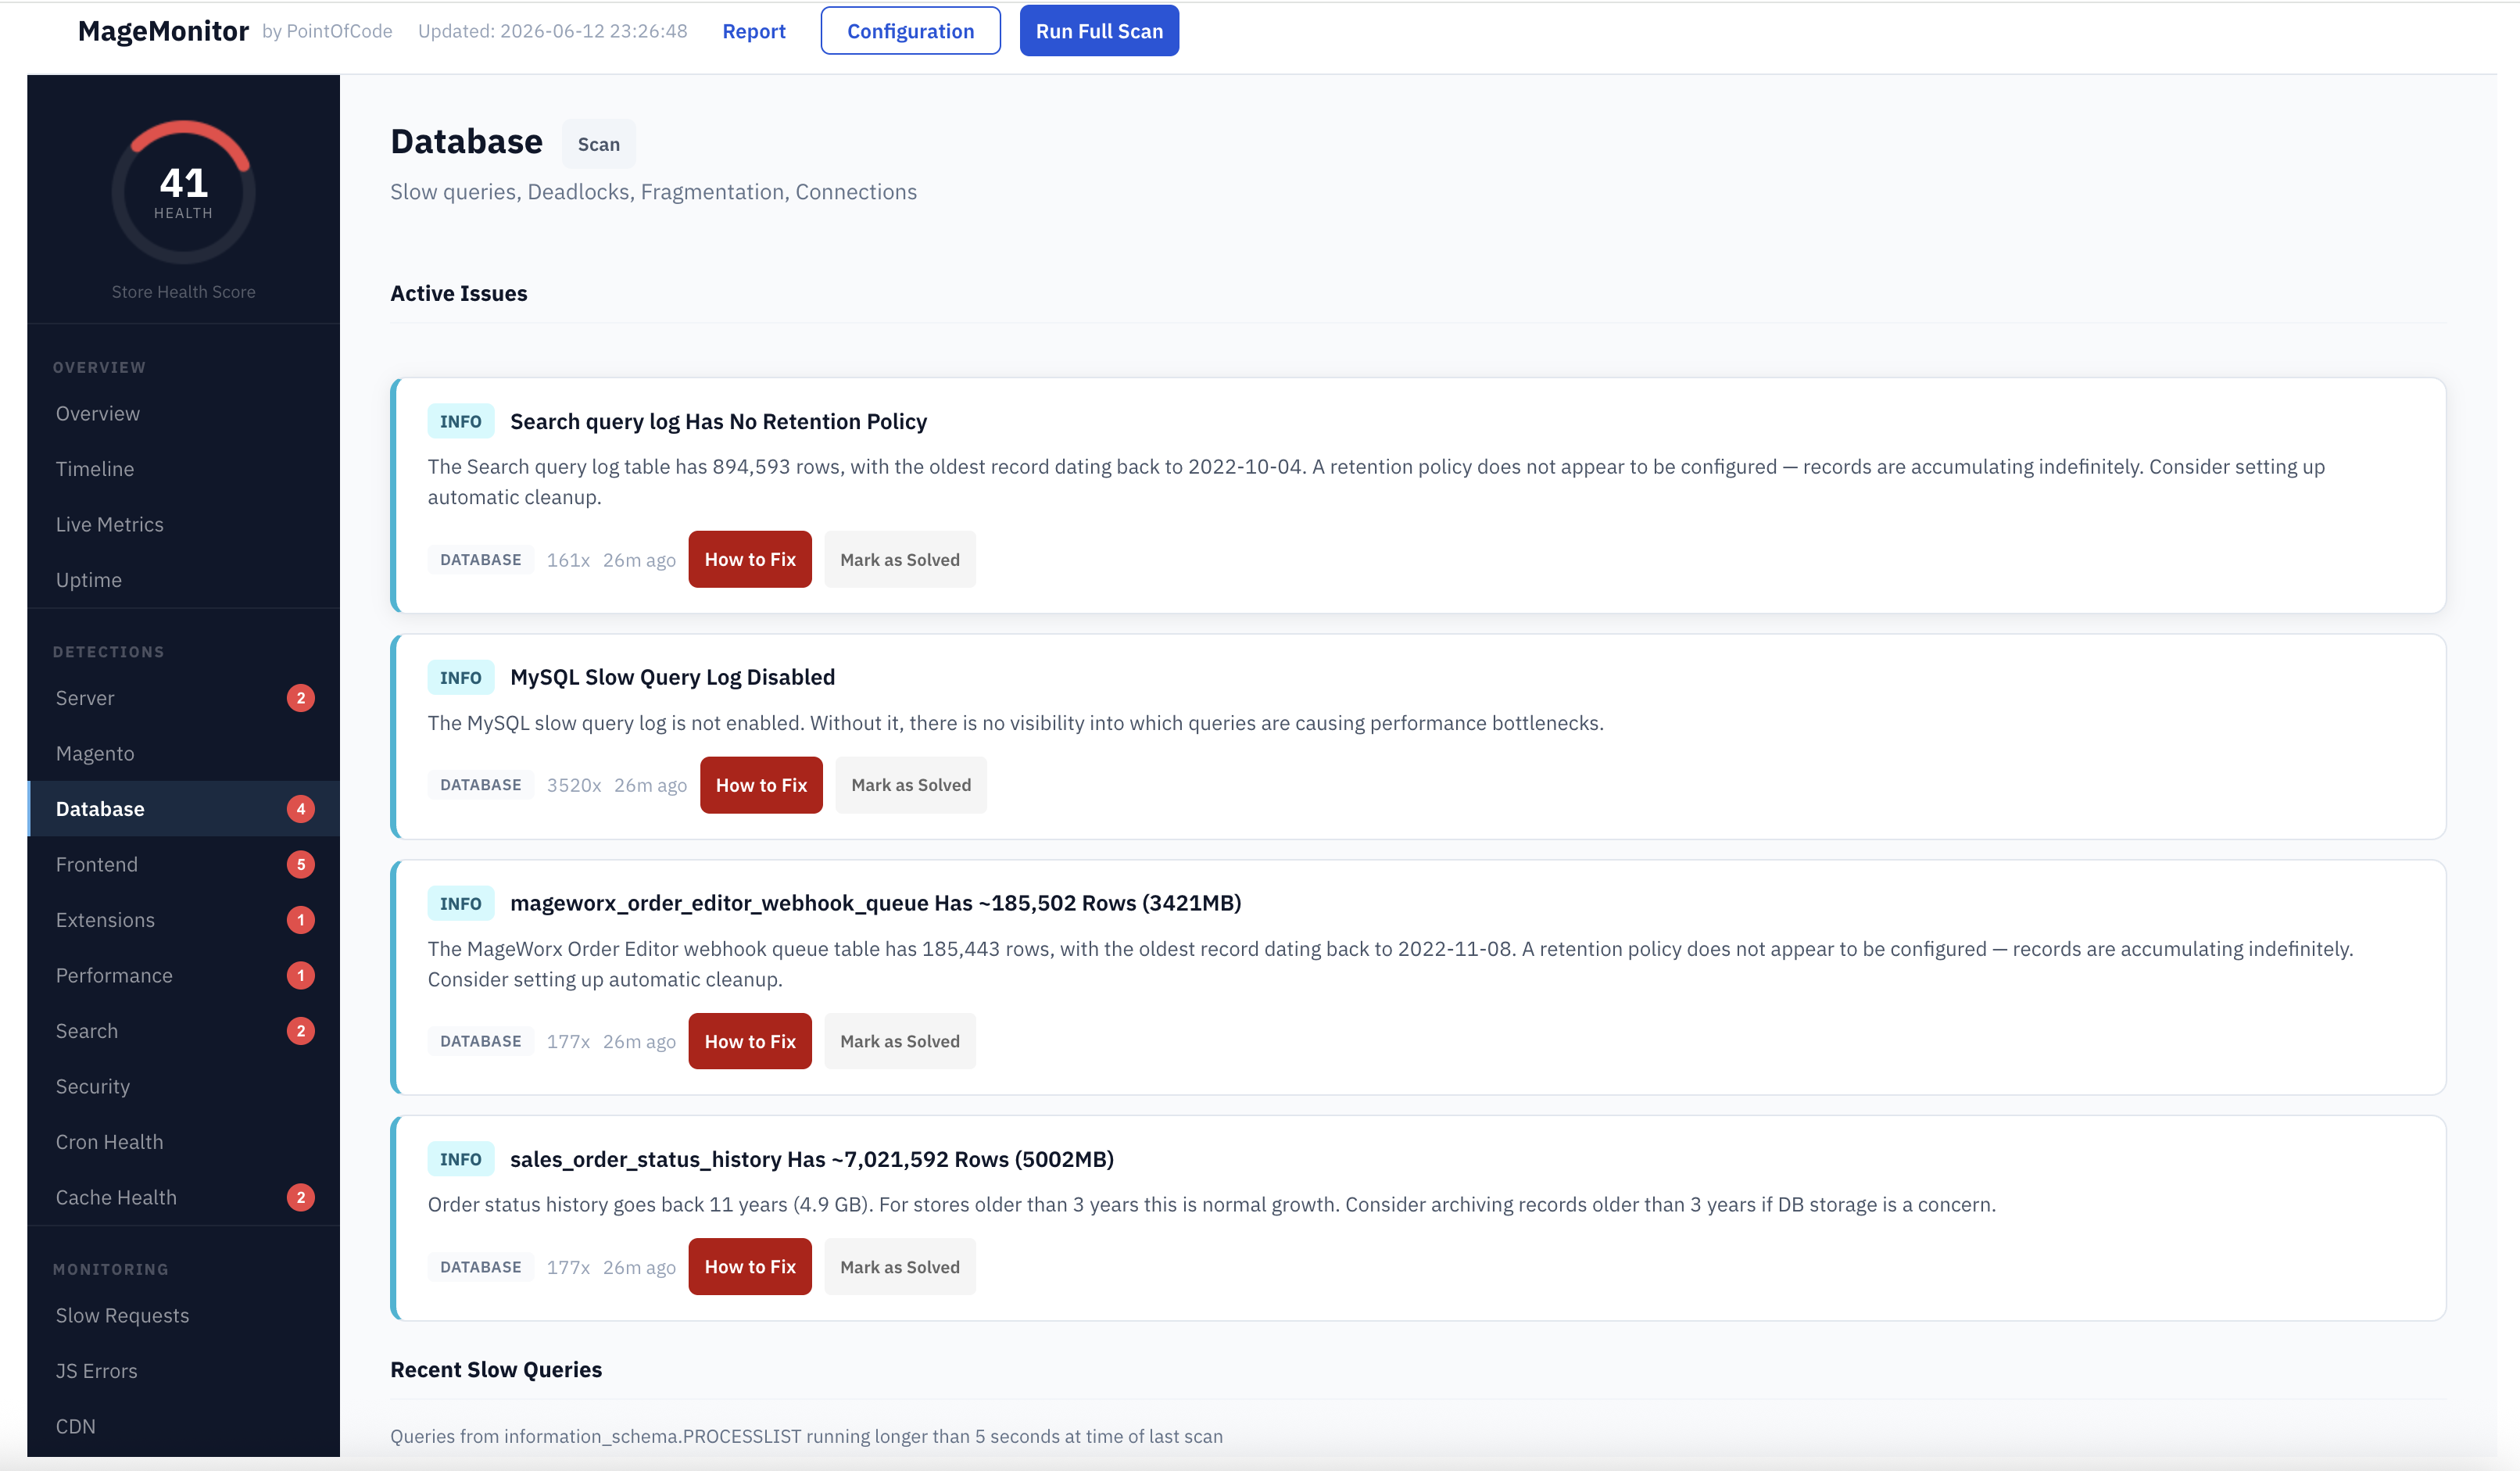
Database Intelligence
The Database tab goes beyond just detecting problems — it automatically discovers which tables are oversized, generates the exact safe SQL to clean them, and shows which tables should never be touched. All read-only.
Live slow queries from information_schema.PROCESSLIST with row color coding (red >30s, orange >10s)
Top 20 largest tables with size, reclaimable space, waste %, rows, and engine
Database Cleanup Opportunities — automated table analysis generates safe DELETE SQL based on actual column structure
NEVER_DELETE protection — order tables, customer tables, EAV tables, archive tables are flagged and blocked from cleanup suggestions
Missing index detection with exact ALTER TABLE statements to fix them
Storage utilization with configurable critical and warning thresholds
Feature 05
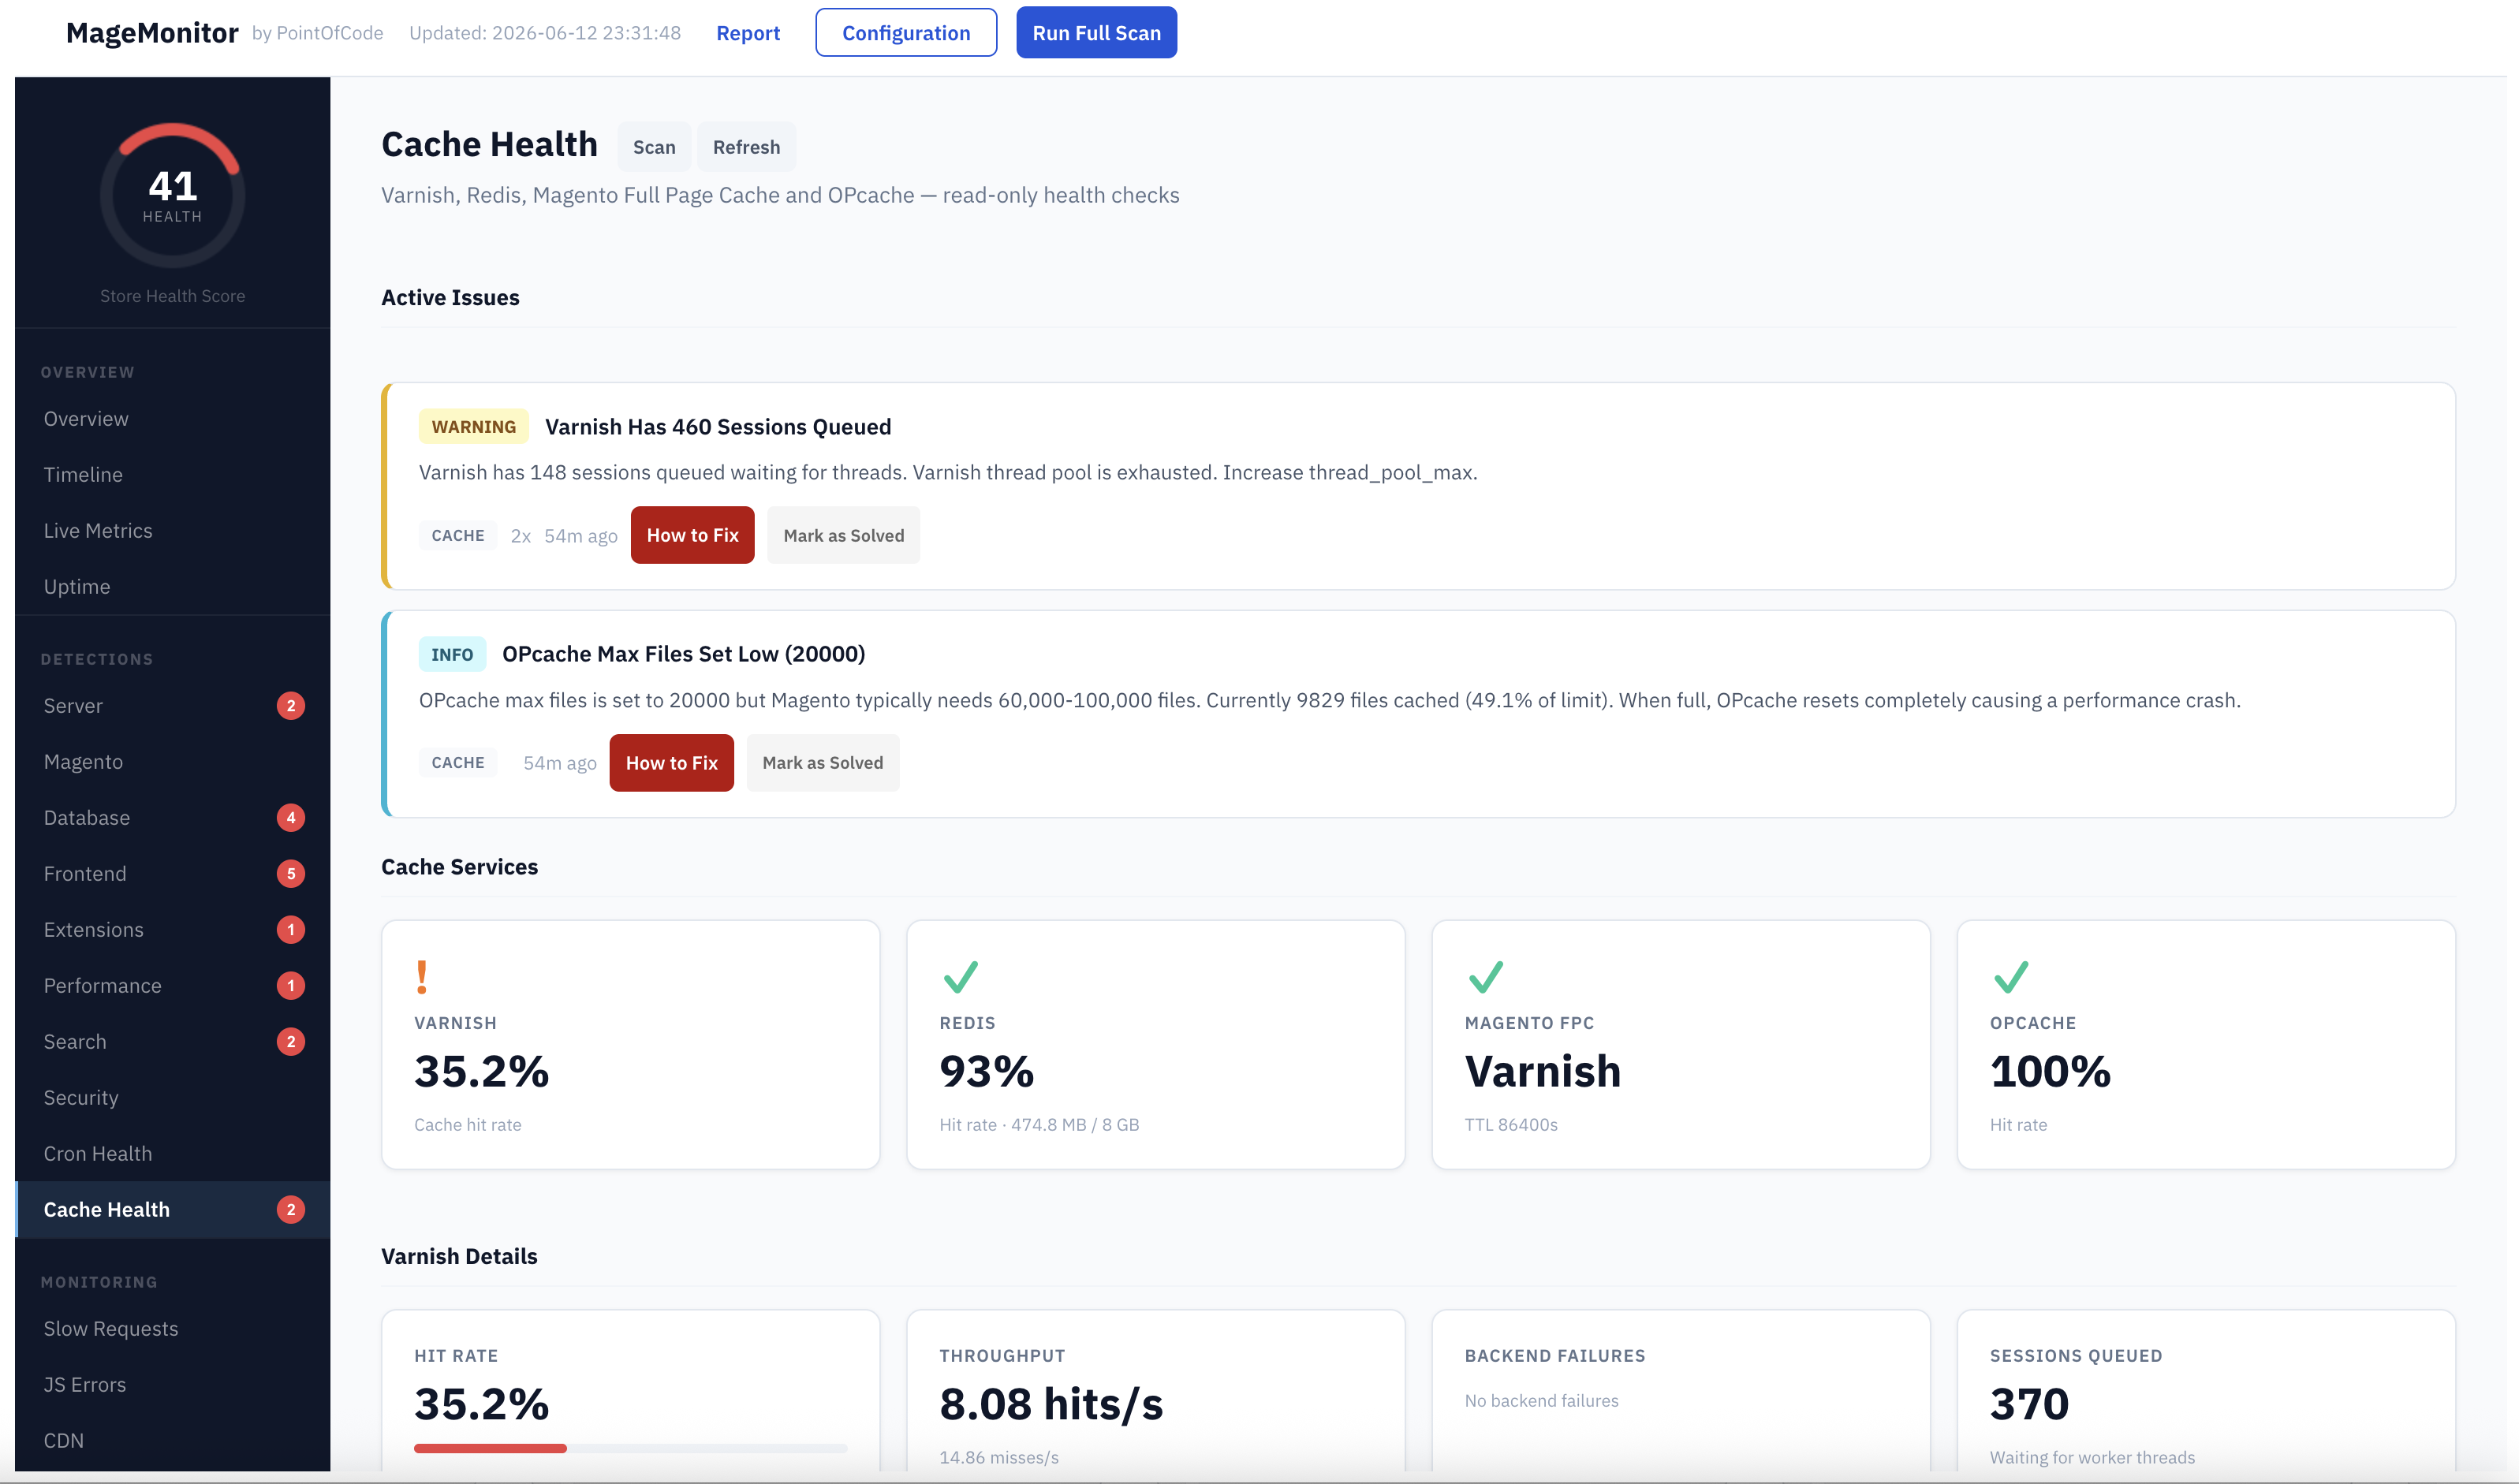
Cache Health Monitoring
Full visibility into every cache layer — Varnish, Redis, Magento FPC, and OPcache. Detects problems before they cause slowdowns or outages. All checks are strictly read-only.
Varnish: running status, hit rate with configurable thresholds, backend failures, sessions queued, objects cached, version
Magento FPC: backend type (Varnish vs built-in), TTL configuration
OPcache: hit rate, memory usage, files cached vs max — warns before OPcache reset threshold
Layered fallback for Varnish stats: direct → cached file → process check → not installed (never errors)
One-click Fix Varnish Permissions button (only shown when Varnish is running and permissions need fixing)
Feature 06
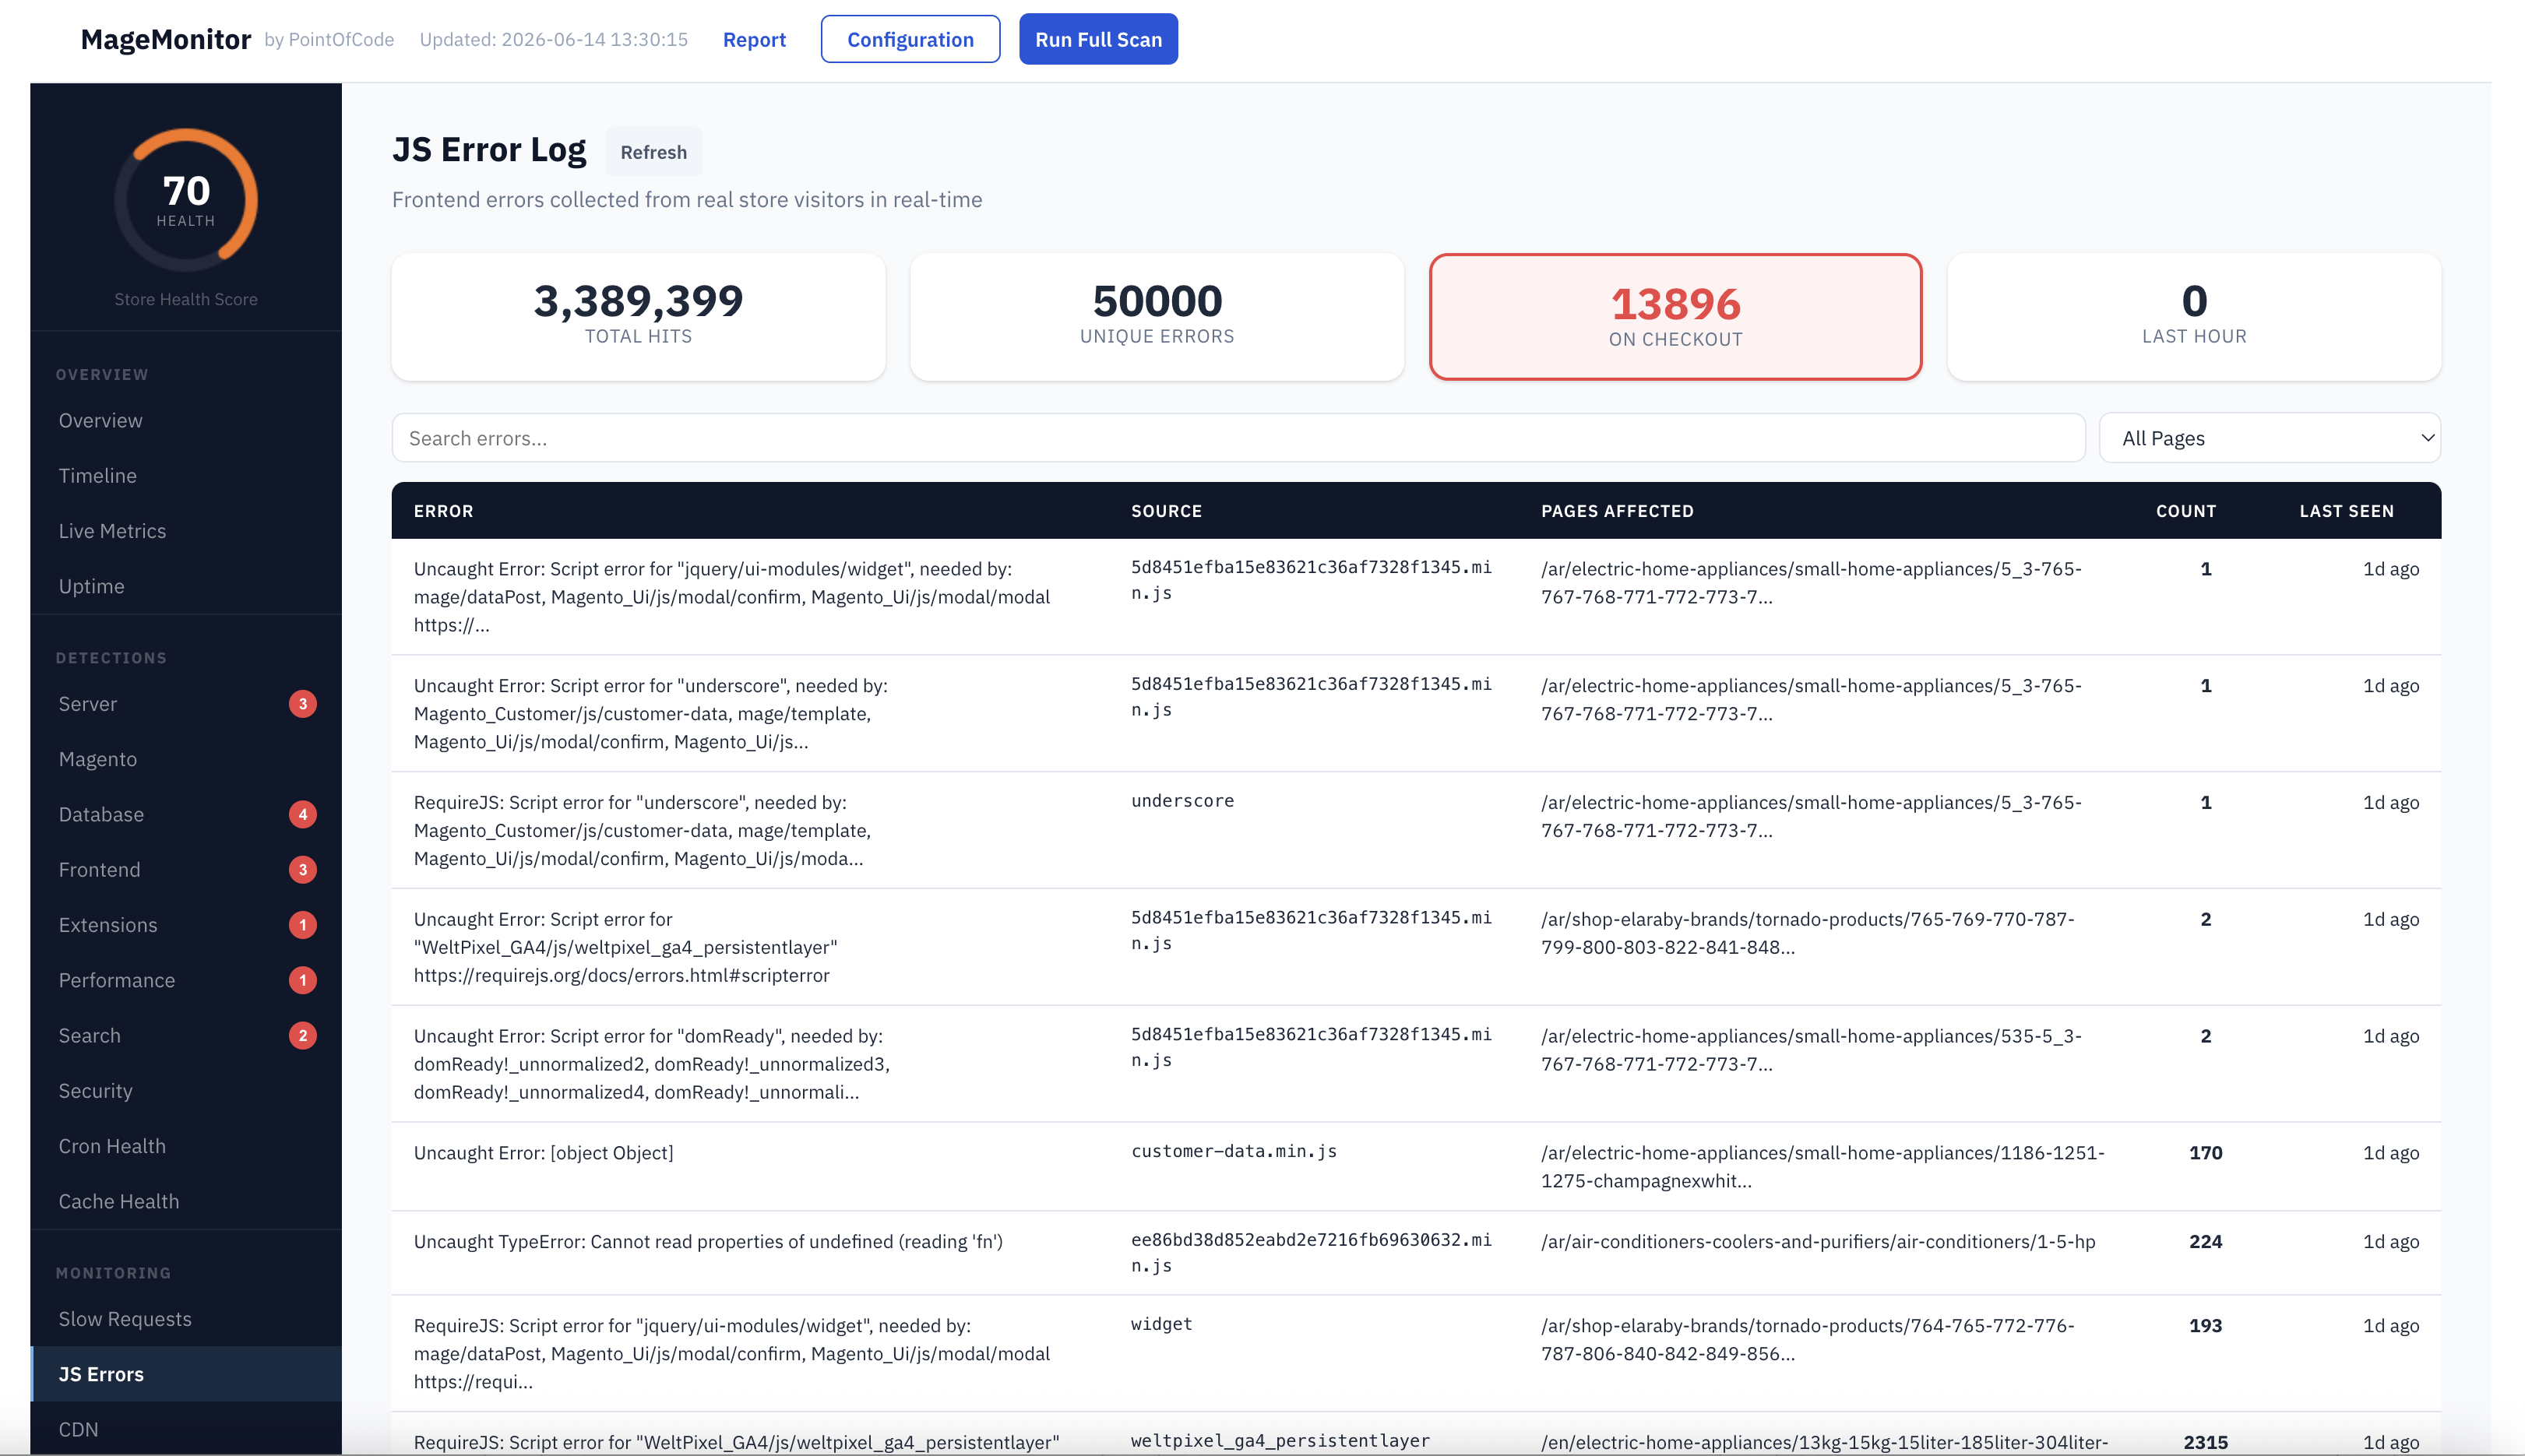
JavaScript Error Collector
A lightweight collector script captures real JavaScript errors from real customer browsers automatically. No manual testing, no browser extensions, no code changes. See exactly which JS errors are affecting your customers and on which pages.
Catches window.onerror, unhandledrejection, and RequireJS module failures
Errors batched client-side and sent every 3 seconds — negligible performance impact
ON CHECKOUT card with filter — immediately shows errors affecting payment flow
Search and page filter — find errors by message, source file, or page URL
Grouped by error fingerprint — same error from 1,000 sessions shows as one row with count
Per-session rate limiting (default 20 errors/session) prevents DB flooding on noisy errors
Feature 07
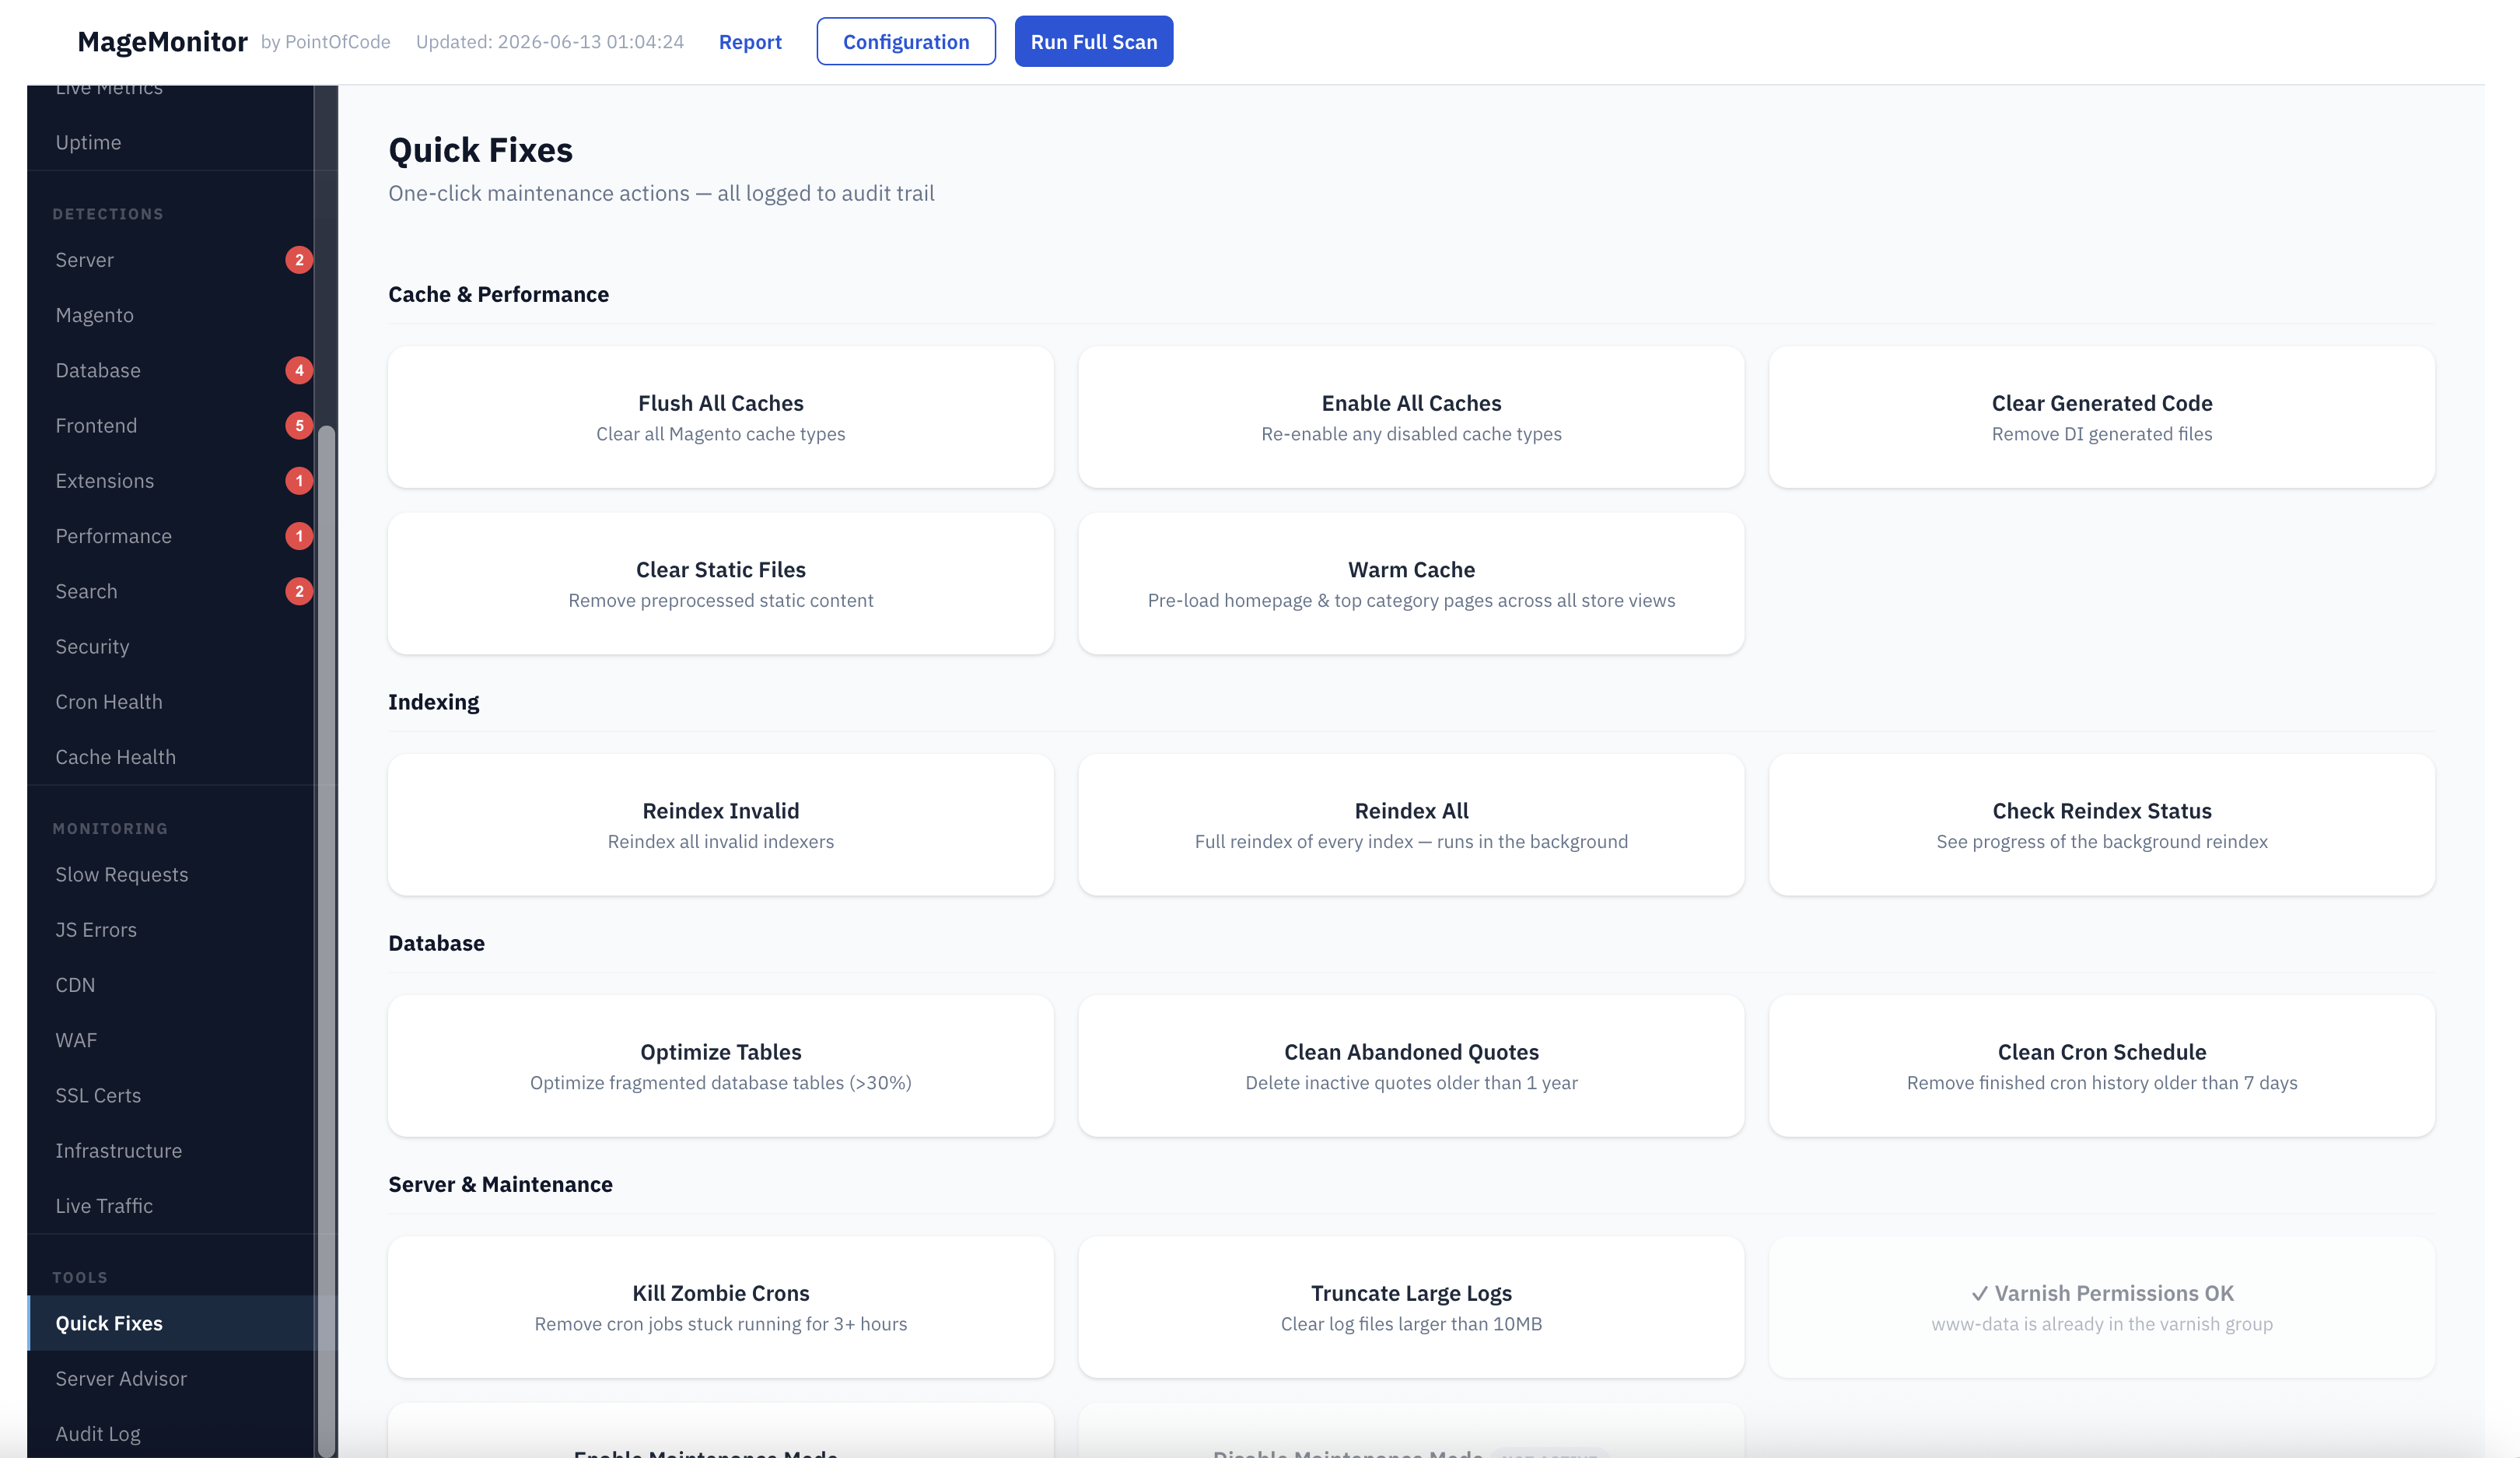
Quick Fixes
One-click maintenance actions that run instantly from the dashboard. Every action is logged to the audit trail with admin username, timestamp, and result. Grouped into logical sections for fast navigation.
Cache: Flush all, enable all, clear generated code, clear static files, warm cache across all store views
Indexing: Reindex invalid (fast) or Reindex All (runs in background with live progress monitor)
Server: Kill zombie crons, truncate large logs, enable/disable maintenance mode (auto-whitelists your IP)
MageMonitor: Test alert, clear detection history, full data reset with confirmation showing exact record counts per table
Feature 08
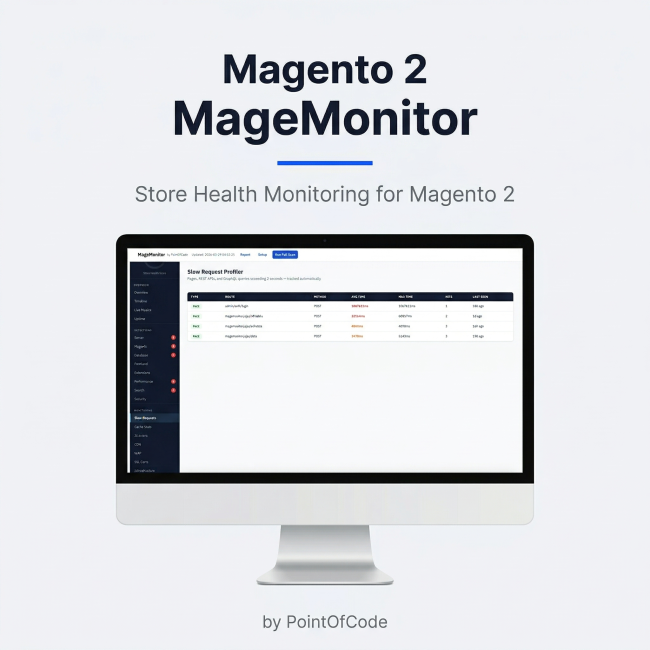
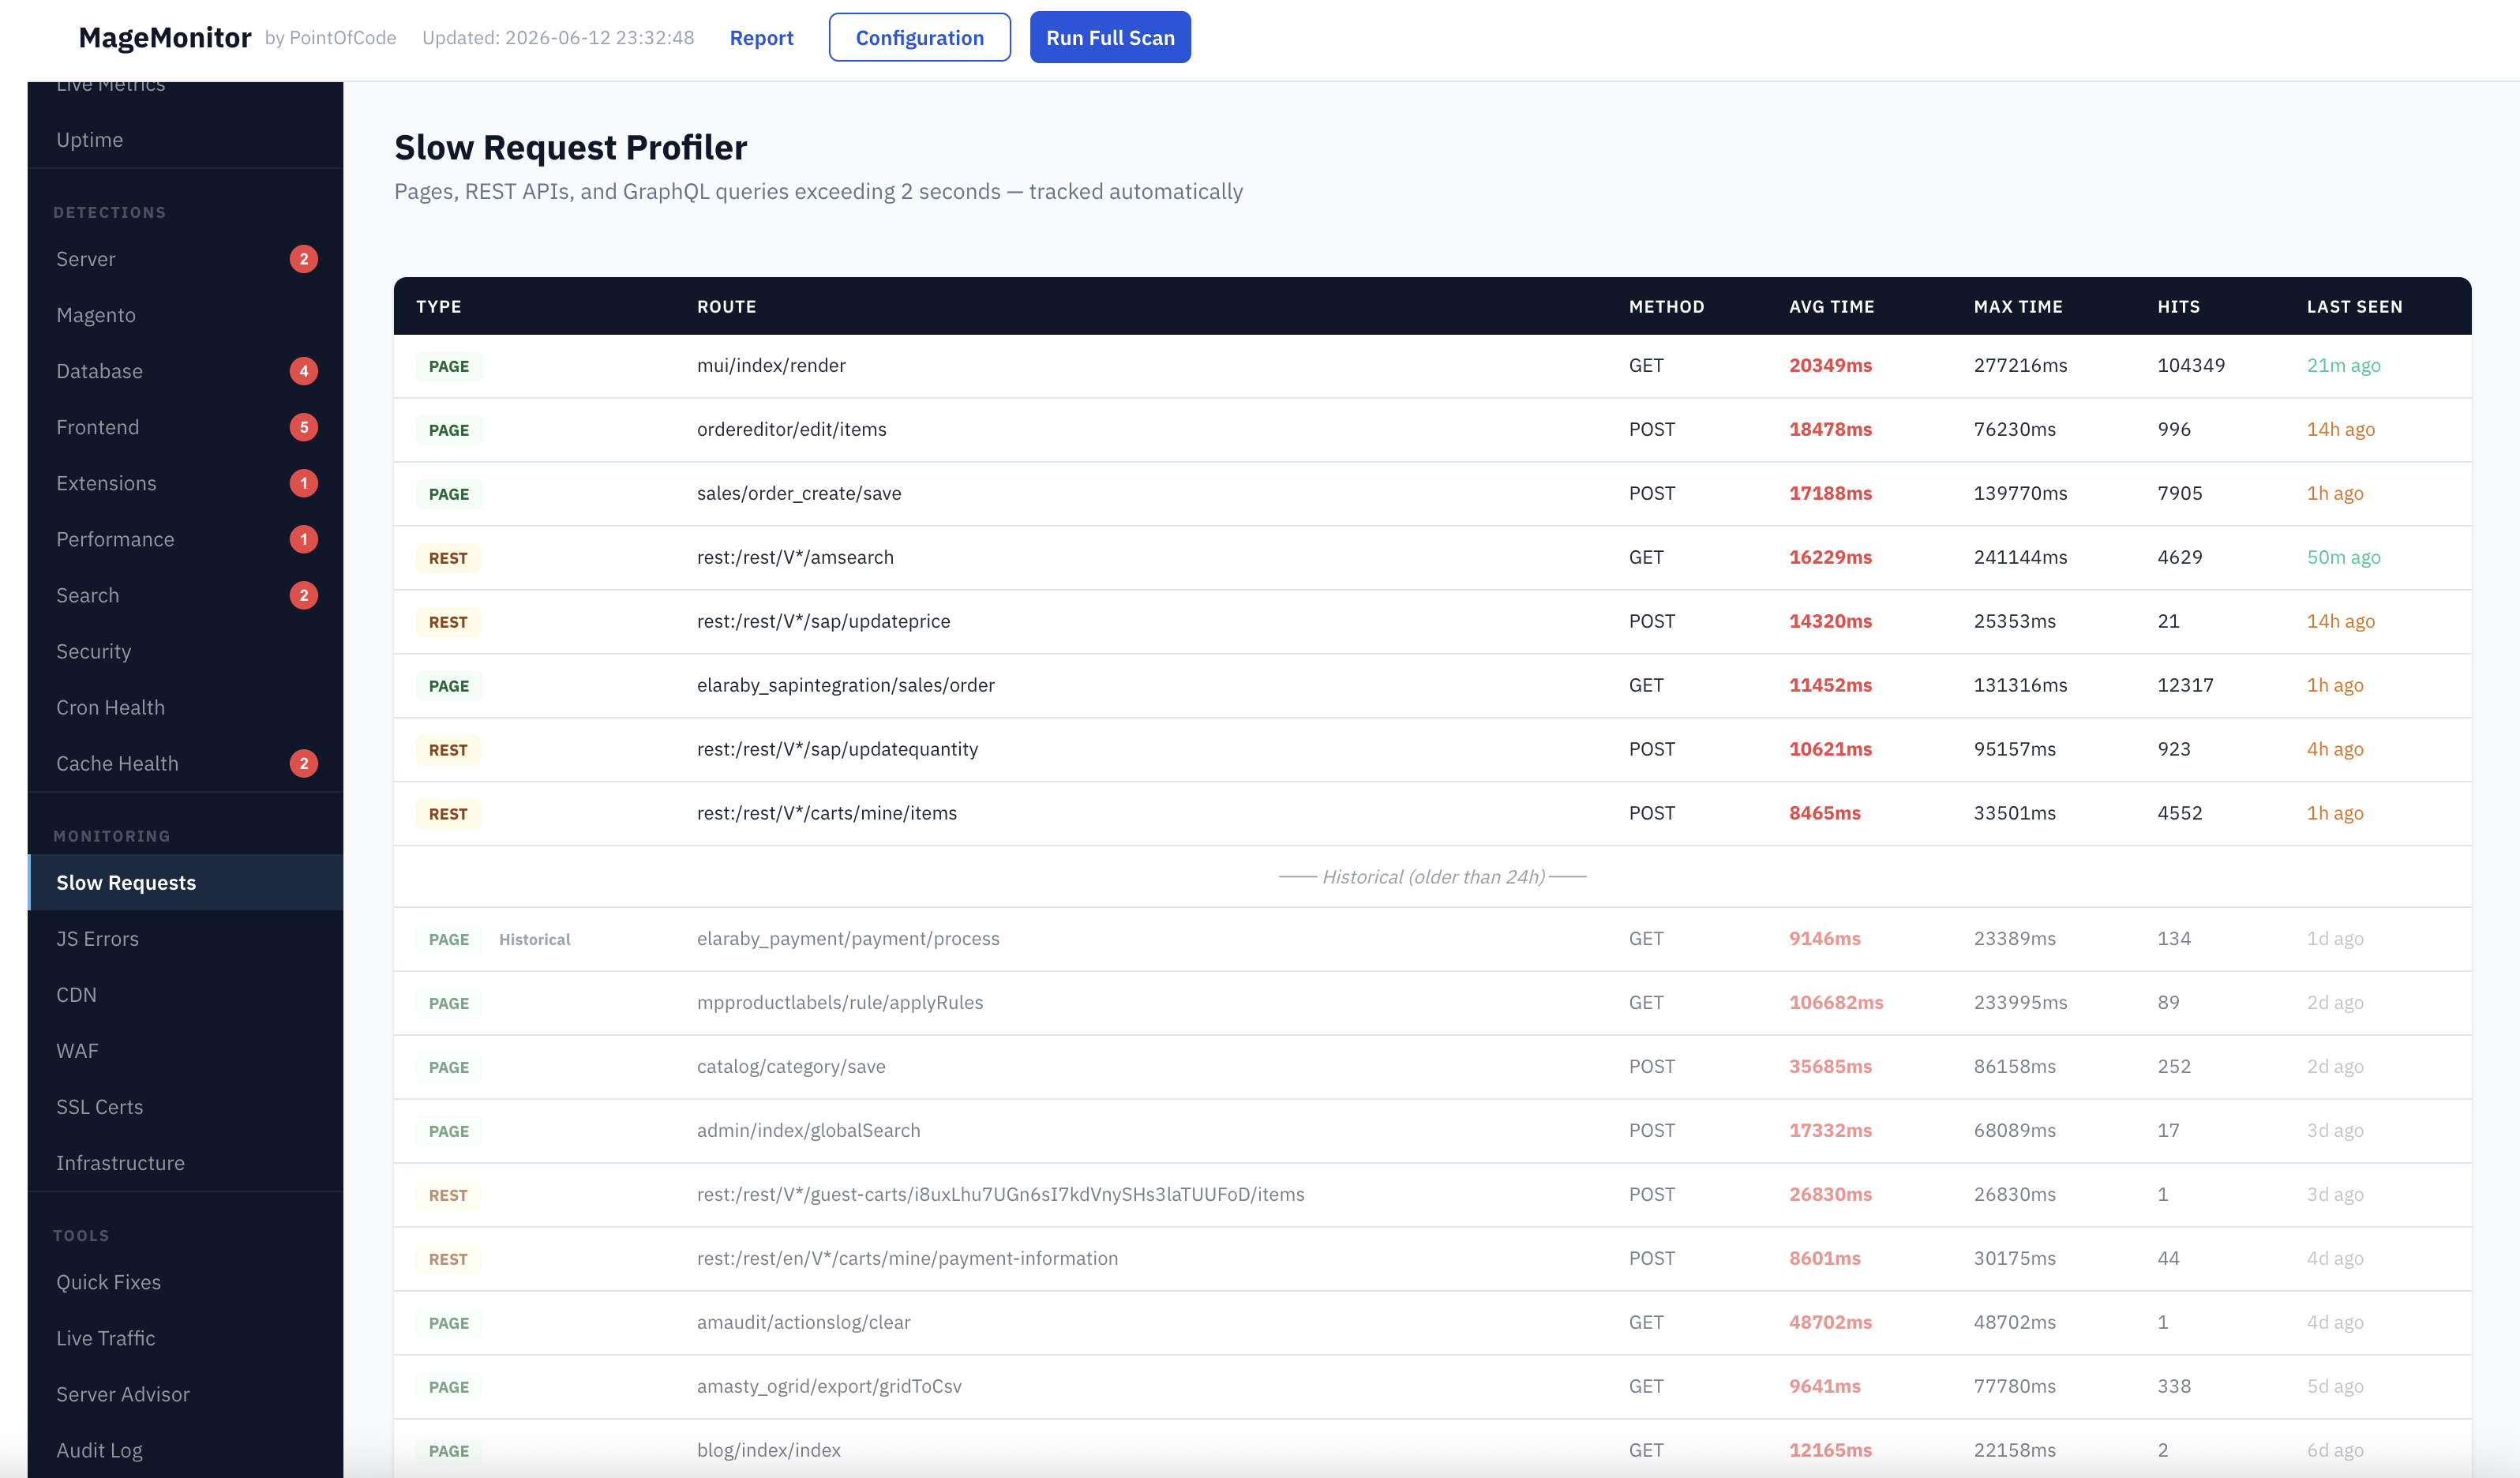
Slow Request Profiler
Automatically tracks every page request, REST API call, and GraphQL query that exceeds your configured threshold (default 2 seconds). No code changes required. Sampling rate is configurable to minimize overhead on high-traffic stores.
Tracks PAGE, REST, and GRAPHQL route types separately with color-coded badges
Average time, max time, hit count, and last seen per route
Active (last 24h) vs Historical sections — active routes sorted by avg time, historical by recency
Last seen color-coded: green <1h, orange 1-24h, gray >24h
Configurable sampling rate (default 10%) — reduce to 5% on stores with 100k+ requests/day
Feature 09
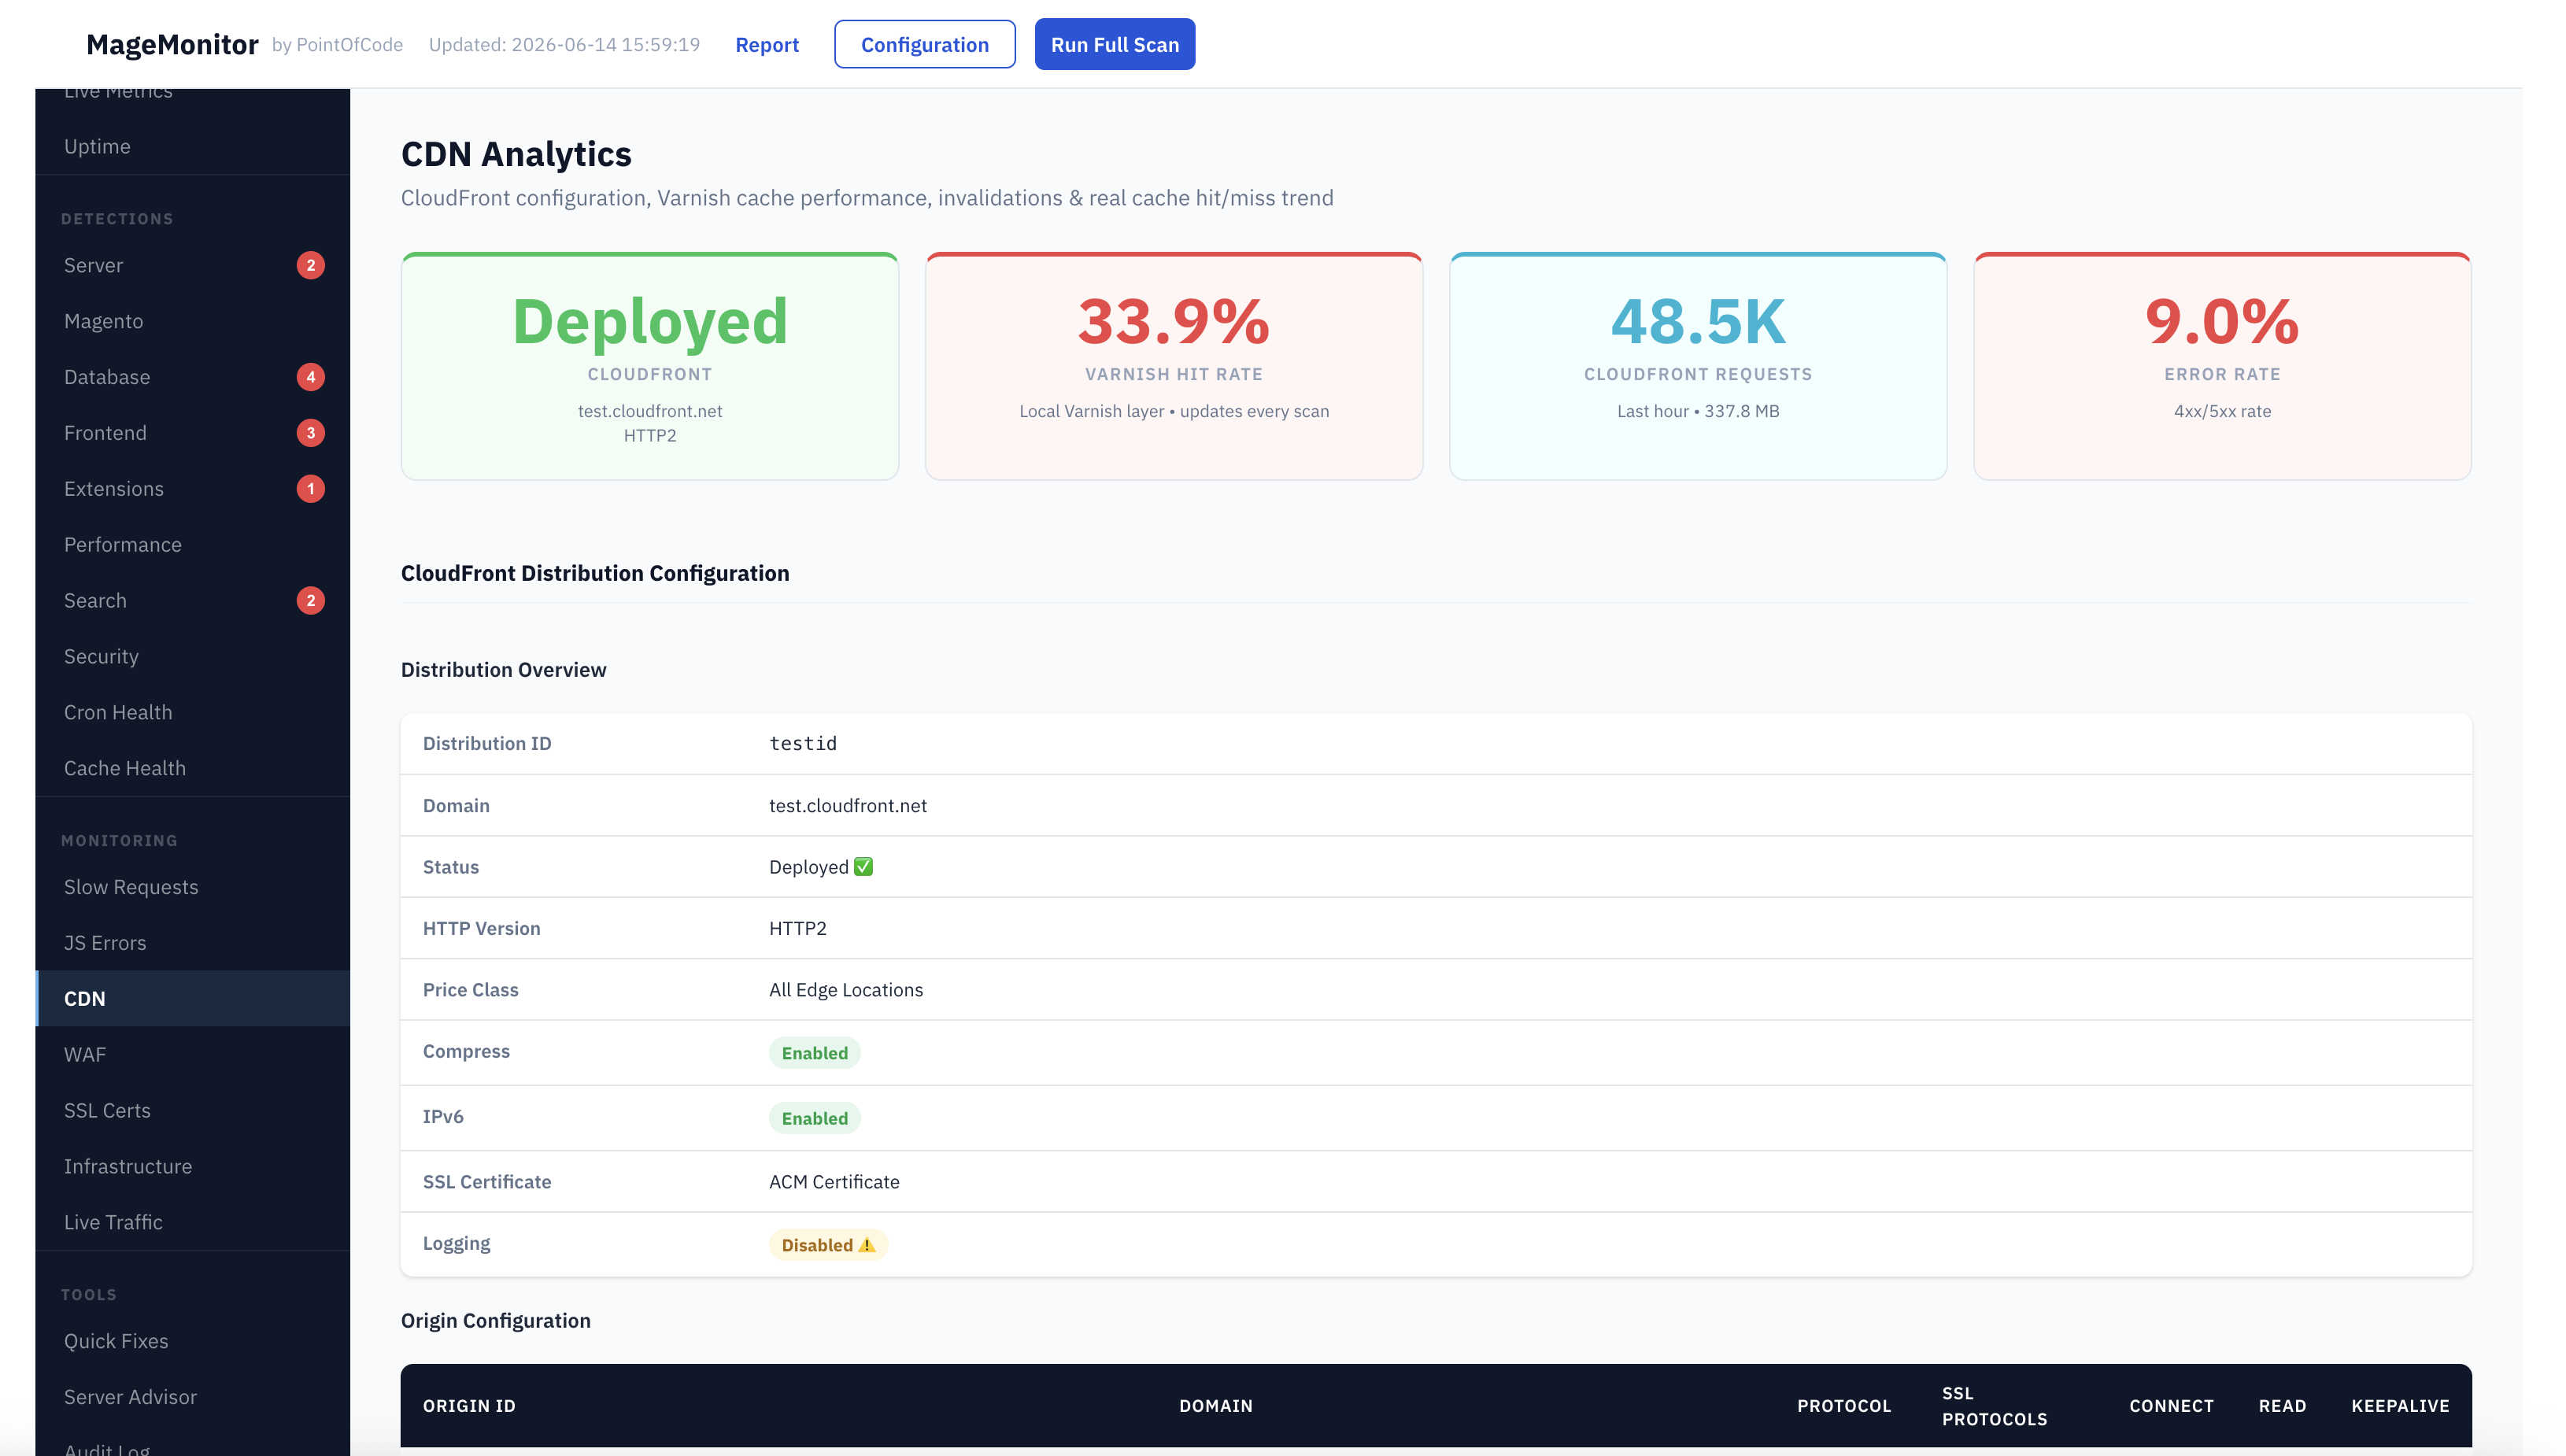
CDN & WAF Monitoring
Deep integration with AWS CloudFront and WAF via IAM Role (no credentials required on EC2). See your entire CDN configuration, cache behavior TTLs, WAF rule status, recent invalidations, and real cache performance from Varnish statistics.
CloudFront distribution overview, origin config, cache behaviors with TTL analysis
Recent invalidation history — see when cache was last cleared and which paths were invalidated
WAF rules table with type badges (MANAGED / CUSTOM / IP SET / RATE LIMIT) and action (BLOCK / COUNT)
IP sets (allowlists/blocklists) with IP count and expand to view addresses
Real Varnish hit rate (most accurate) — fetched from varnishstat directly
Response code distribution from sampled traffic + cache hit/miss trend from uptime probes
Smart CDN recommendations based on actual configuration findings
Also supports Cloudflare integration (API Token + Zone ID)
Feature 10
Multi-Channel Alerts
Get notified the moment something goes wrong — via Email, Slack, or Webhook. Each channel has its own digest schedule. Downtime alerts fire within 3 minutes of detection.
Email Alerts
Instant alerts for new critical issues. Configurable digest (hourly/daily/weekly). Immediate downtime and recovery notifications. Multiple recipients supported.
Slack Notifications
Incoming Webhook integration. Sends to any channel. Independent digest frequency from email. Includes store name, health score, and issue count in every message.
Webhook Integration
POST to any HTTPS endpoint. HMAC-SHA256 signed payload for verification. JSON format with full detection data. Compatible with PagerDuty, custom dashboards, and any HTTP endpoint.
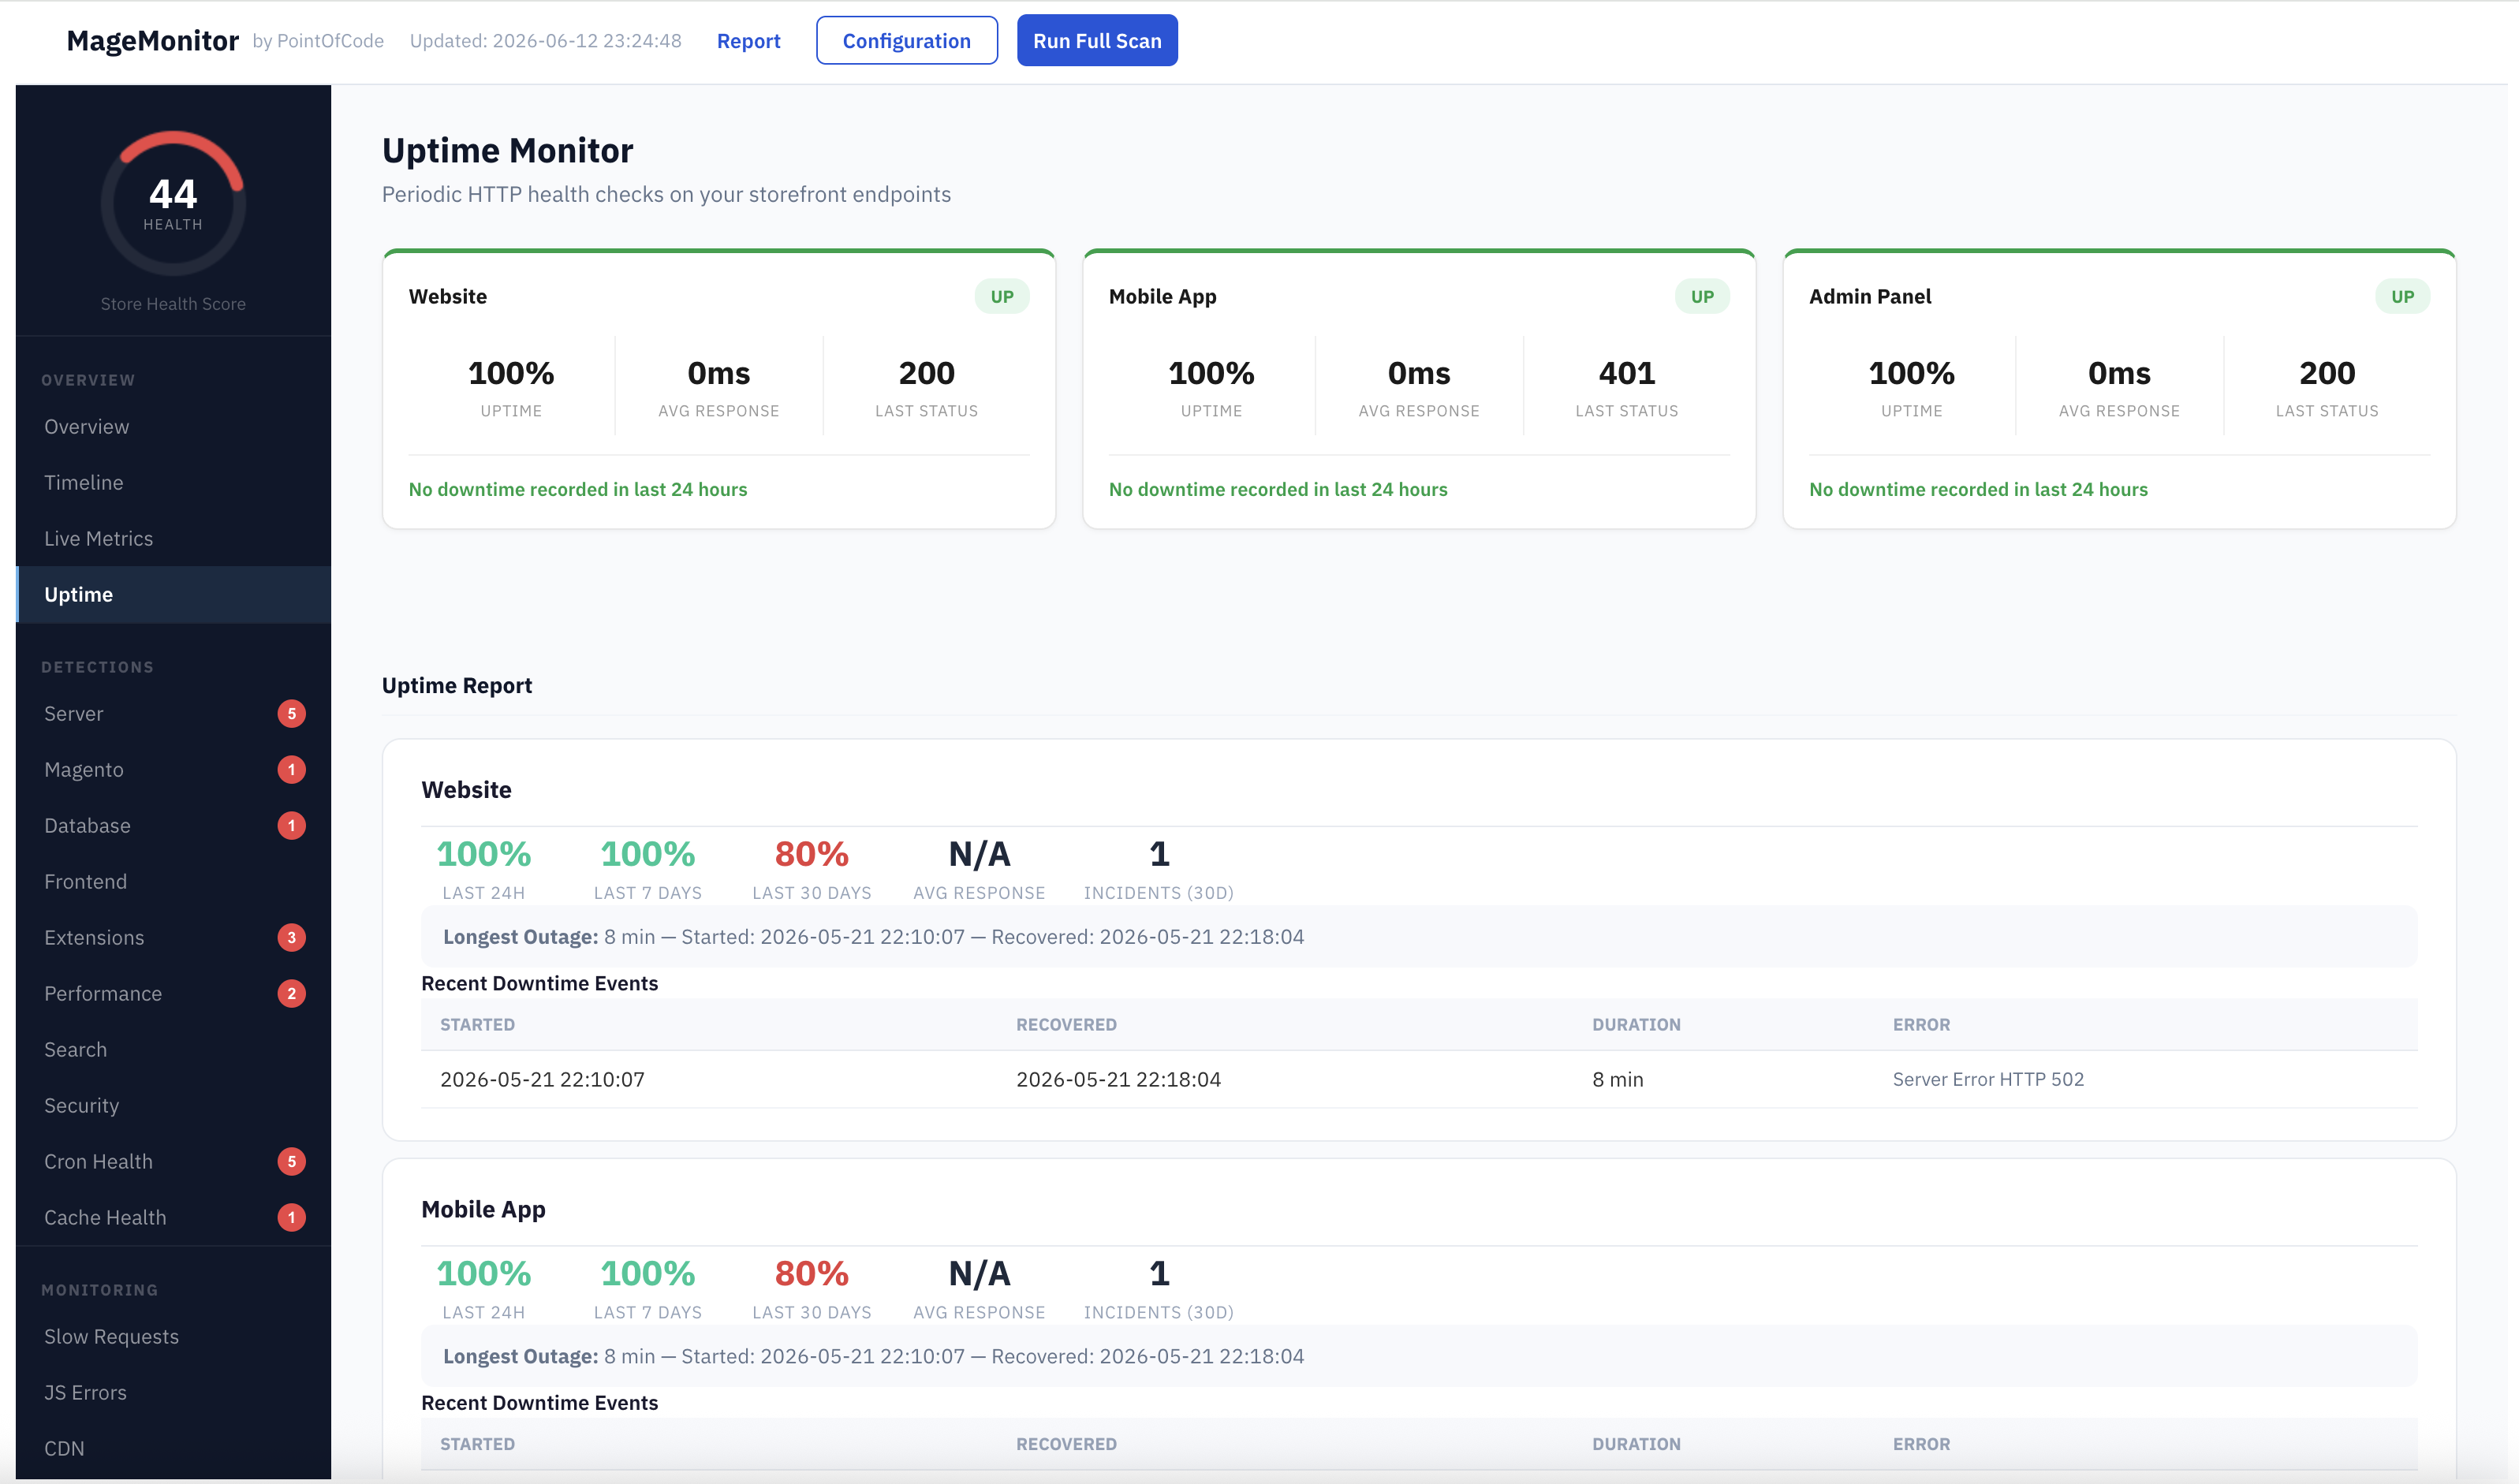
Feature 11
Uptime Monitoring
Checks your store's uptime every 3 minutes via cron. Two consecutive failures required before alerting — preventing false positives from transient network issues. Separate uptime percentage and response time tracking per URL.
Immediate DOWN and RECOVERY email alerts when status changes
Configurable timeout per URL (default 10s) for slow APIs or remote endpoints
Feature 12
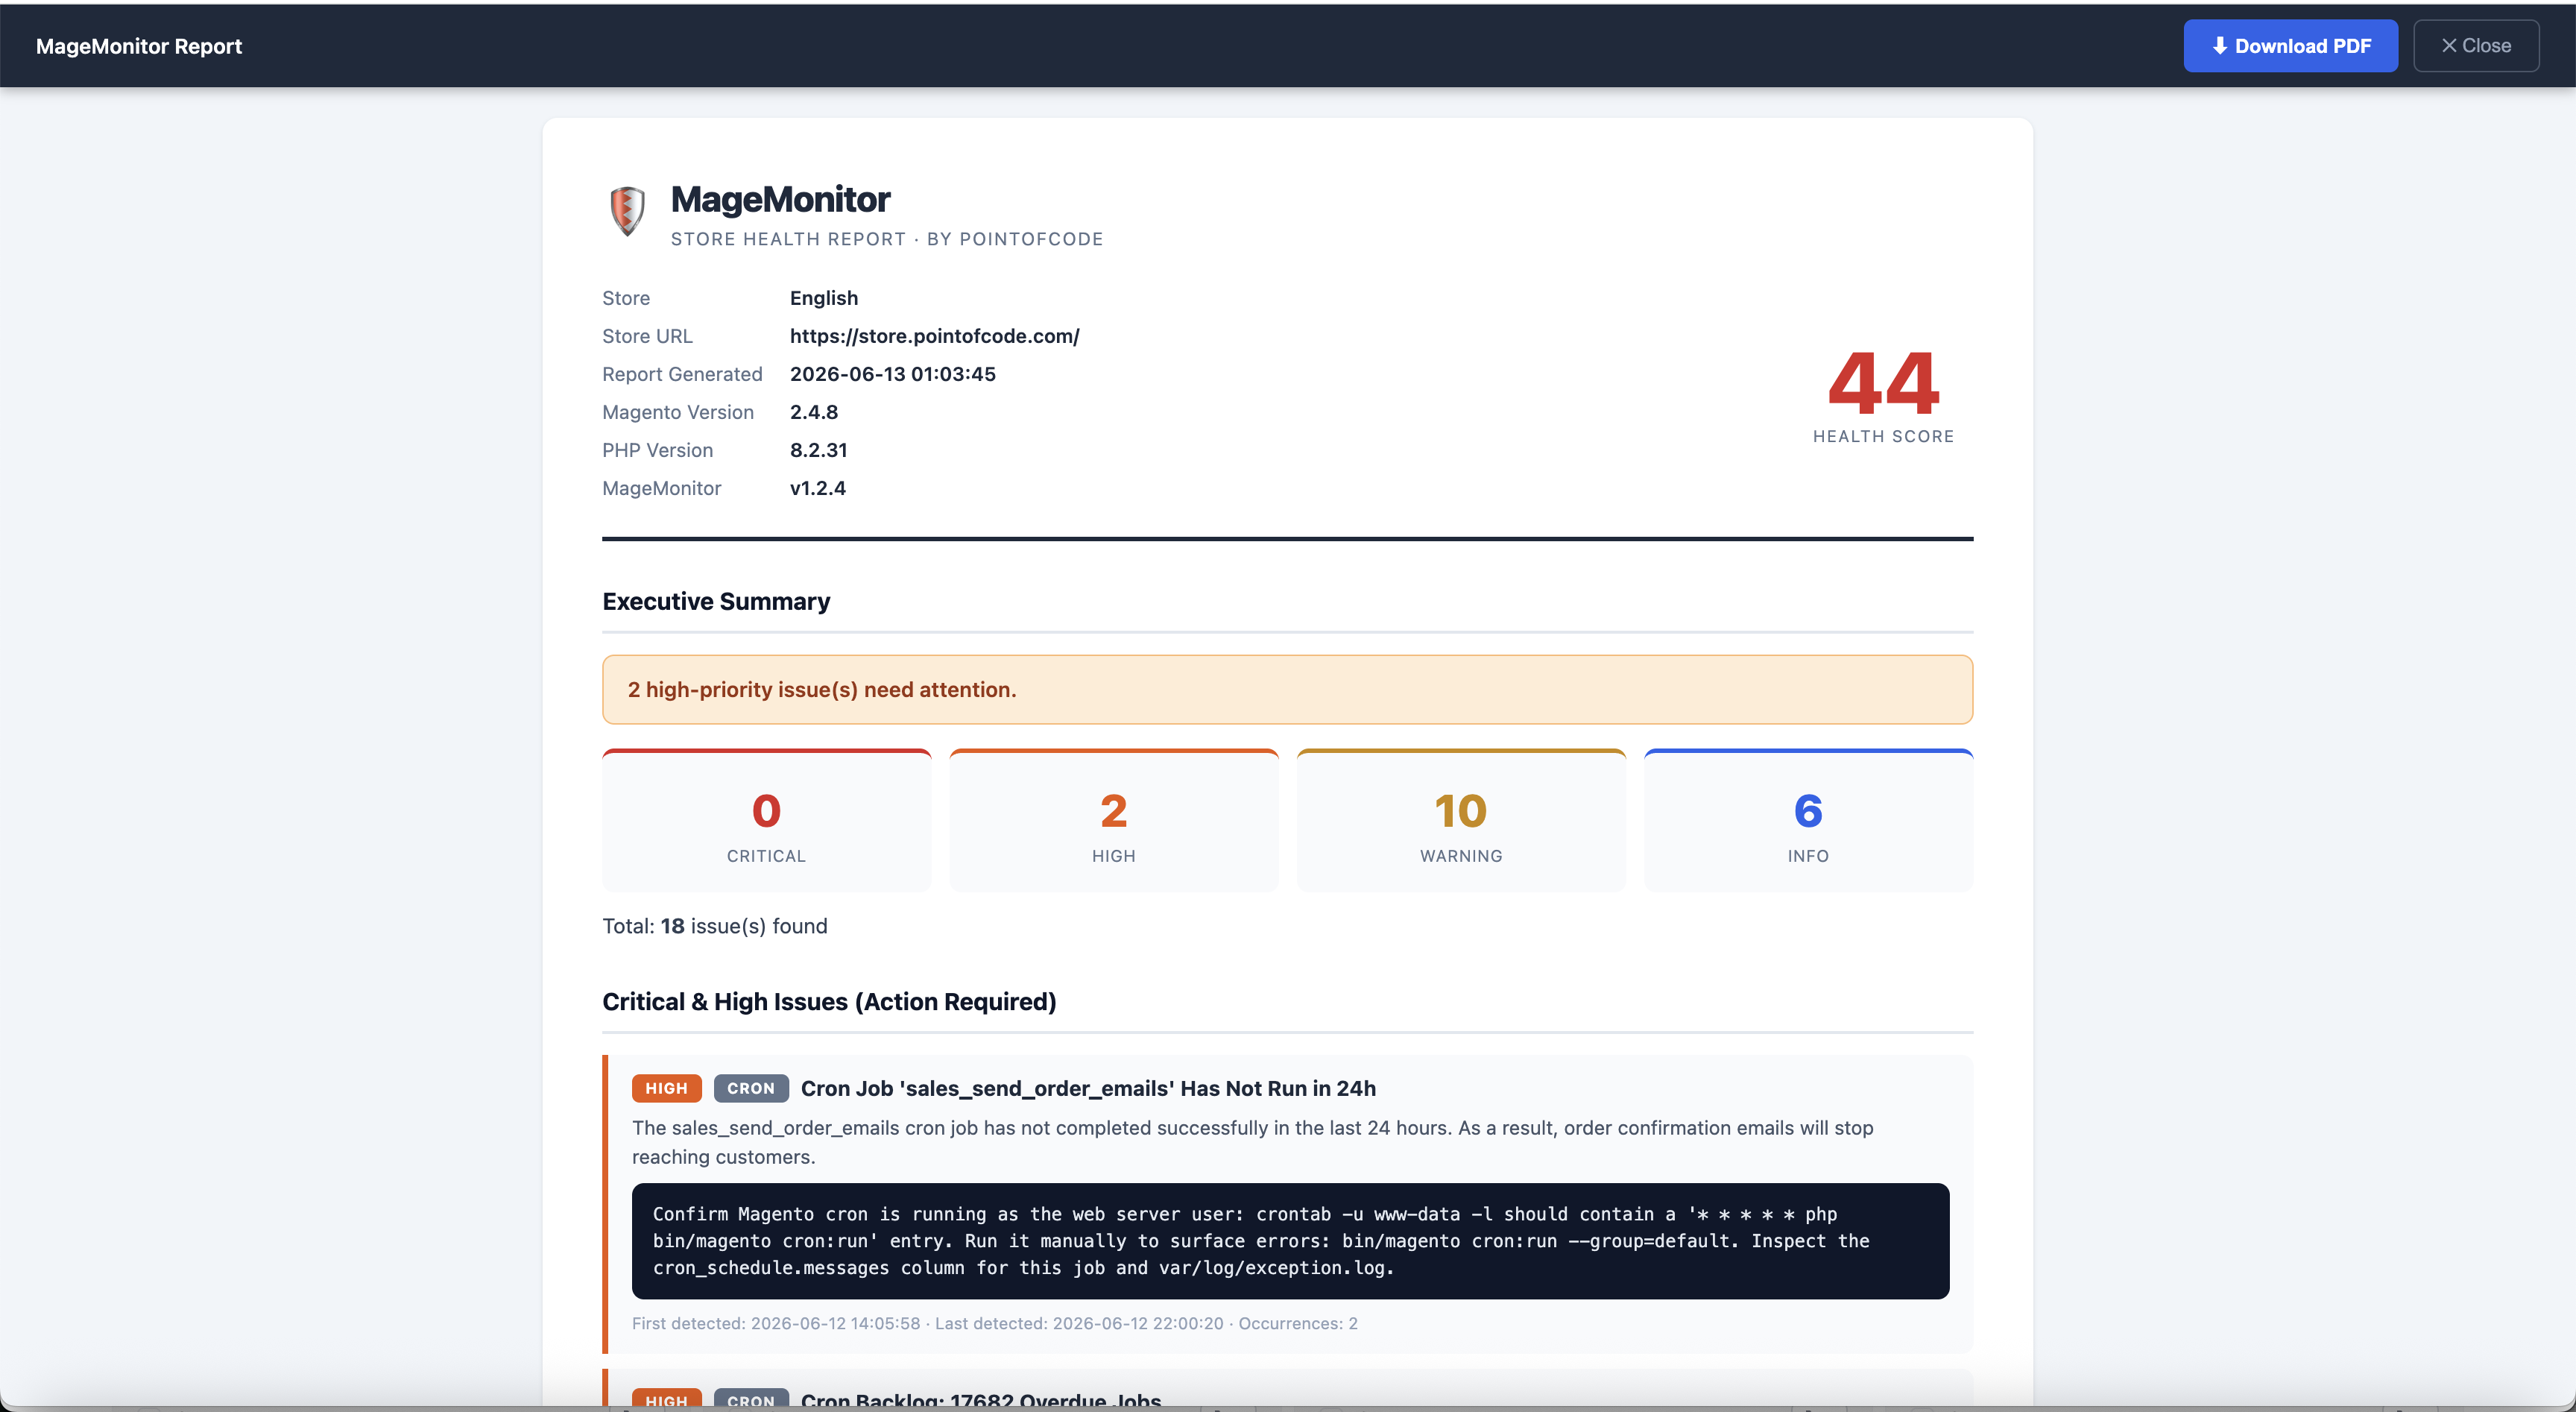
Health Report & PDF Export
Generate a complete store health report in one click. Opens as a self-contained HTML page with a Download PDF button that uses your browser's native print-to-PDF — no server-side PDF libraries required, works on any server.
Executive summary with issue counts by severity
All Critical and High issues with how-to-fix instructions
Server health snapshot, database status, cache health, cron summary
Uptime summary, top JS errors, SSL certificate status
Auto-generated recommendations ordered by business impact
Print-optimized CSS — clean PDF output with preserved severity colors
Feature 13
Additional Monitoring Tools
Beyond the core detection tabs, MageMonitor includes a full suite of operational and monitoring tools.
Live Traffic
Real-time feed of sampled requests showing route, response time, status code, and type (PAGE/REST/GRAPHQL/ADMIN). Auto-updates every refresh.
SSL Certs
Auto-checks all store domains every 6 hours. Shows issuer, expiry date, days remaining. Warning at 30 days, Critical at 7 days.
Audit Log
Tamper-evident log of every Quick Fix action with admin username, timestamp, and result. Cannot be edited or deleted through the UI.
Infrastructure
Detailed server environment info including PHP config, Redis config, deployment mode, and MageMonitor's own storage usage breakdown per table.
Server Advisor
Personalized server tuning recommendations calculated for your actual server specs — PHP-FPM pool, OPcache, Redis memory, MySQL buffer pool.
Timeline
Chronological history of all detections — when issues were first seen, when resolved, and how the health score changed over time.
Quick Fixes — Full List
15 One-Click Actions
Every action is logged to the audit trail. Destructive actions require explicit confirmation showing exactly what will be affected.
Flush All Caches
Clears all Magento cache types
Enable All Caches
Re-enables any disabled cache types
Warm Cache
Pre-warms Varnish/FPC for all active store views after deployment
Clear Generated Code
Removes DI interceptors from var/generated/
Clear Static Files
Removes compiled CSS/JS from pub/static/
Reindex Invalid
Fast reindex of invalid indexers only
Reindex All
Full reindex in background with live progress monitor
Optimize Tables
Reclaims fragmented space from large tables (>30% waste)
Clean Expired Quotes
Removes abandoned carts older than 1 year
Clean Cron Schedule
Purges old success/missed/failed cron history (>7 days)
Kill Zombie Crons
Frees cron jobs stuck in "running" >3 hours
Truncate Large Logs
Clears log files >10MB from var/log/
Enable Maintenance Mode
Puts store in maintenance — auto-whitelists your IP so you keep admin access
Clear Detections
Clears detection history only. Keeps all other monitoring data. Shows exact count before confirmation.
Reset MageMonitor
Clears ALL monitoring history. Shows exact record count per table. Requires typing "RESET" to confirm. License key preserved.
How It Works
Running in minutes. Monitoring in seconds.
Standard module installation. No external accounts, no complex infrastructure, no configuration beyond pasting your license key.
1
Upload & Enable
Upload to app/code/PointOfCode/MageMonitor/ and run setup:upgrade. Module registers all cron jobs and creates its database tables automatically.
2
Enter License Key
Paste your license key in Stores → Configuration → PointOfCode → MageMonitor. Your domain is auto-detected. Validation is instant.
3
Run First Scan
Click "Run Full Scan" in the dashboard header. All 10 detectors run immediately. Results populate across all tabs within seconds.
4
Monitor & Fix
Work through detections using built-in fix guides. Configure alerts. Cron handles everything automatically from this point on.
Complete Feature List
Everything Included.
No add-ons. No upsells. No tiers. One license covers one domain.
Overview & Dashboard
Real-time health score (0–100)
10 category cards with detection counts
Critical & High issues on overview page
Mark as Solved and How to Fix per detection
Detection timeline and scan history
One-click full scan across all categories
Exportable health report with PDF download
Severity levels: Critical, High, Warning, Info
Security & Integrity
File integrity SHA-256 monitoring
Admin brute force detection (configurable threshold)
Admin login audit trail
WAF event monitoring (AWS WAF / Cloudflare)
Exposed sensitive file detection
Missing security headers detection
SSL certificate expiry monitoring (all domains)
SSL alert at 30 days warning, 7 days critical
Server & Infrastructure
CPU, RAM, disk with live progress bars
PHP-FPM health, OPcache, Redis detection
Live slow queries from PROCESSLIST
Database connections vs max monitoring
DB size with configurable storage thresholds
MySQL/MariaDB buffer pool analysis
Auto-refresh every 10 seconds
Full system details table (PHP, MySQL, Redis config)
Dedicated ACL roles for dashboard access control per admin user
License
Domain-bound license key. One license = one domain. Transfer available on request.
Support
Direct support from the Point of Code team via store.pointofcode.com
About Point of Code
MageMonitor is developed and maintained by Point of Code, a Magento 2 extension and solutions company. Every feature is built from real production experience running and monitoring large-scale Magento stores. All detections are tested against real merchant environments — not synthetic data. Support is provided directly by the team that built the product.
 English
 العربية